Adapting Open-Source LLMs to Protein Modality via Post-Training
March 20, 2026
Protein language models — ESM-2 [1], ESM-3, ProtTrans, and others — have demonstrated that self-supervised pre-training on amino acid sequences can capture rich structural and functional signals. However, these models predominantly operate on raw amino acid sequences as their sole input representation. While effective for per-residue classification and embedding-based retrieval, this sequence-only paradigm has important caveats: (1) the learned representations remain locked in high-dimensional embedding space, inaccessible to natural-language reasoning; (2) downstream tasks require task-specific heads, limiting generalization; and (3) the models cannot articulate why a protein has certain properties — they predict but do not explain.
Meanwhile, general-purpose LLMs excel at instruction-following, multi-step reasoning, and structured output generation, but treat protein sequences as opaque character strings with no biological grounding. Recent work on multimodal LLMs (LLaVA [2], Flamingo [3]) has shown that frozen encoders from one modality can be bridged into LLMs via learnable projectors — but this recipe has been explored primarily for vision, not for biological sequences.
Can we adapt an open-source LLM to effectively leverage protein structural embeddings — going beyond raw amino acid sequences to reason about structure, function, and evolutionary relationships — by bridging a protein encoder with an LLM via post-training?
Approach Overview
We connect two worlds: ESM-3, a protein foundation model that encodes structural and evolutionary knowledge into 1536-dimensional embeddings, and Qwen3-8B-Instruct [8], a general-purpose LLM. A learnable bridge (attention pooling + projector) translates between them. ESM-3 stays frozen; the LLM adapts via LoRA [4].
Our core comparison is between two pathways: Text-only, where the raw amino acid sequence is fed directly as tokens, and ESM-3 + MLP, where ESM-3 embeddings are projected into the LLM's input space. The MLP projector serves as a simple, interpretable bridge — it can be replaced with more expressive alternatives like the Perceiver Resampler [7] (cross-attention) or Flamingo-style [3] gated cross-attention, which we have implemented but not yet evaluated at scale.
| Approach | How protein enters the LLM | Trainable params | Status |
|---|---|---|---|
| Text-only | Raw sequence as <protein>MKTL...</protein> tokens | ~2M (LoRA only) | Core comparison |
| ESM-3 + MLP | ESM-3 → AttentionPooling (32 tokens) → MLP projector | ~32.5M | Core comparison |
| ESM-3 + Perceiver | ESM-3 → Perceiver Resampler (cross-attention) | ~31.4M | Implemented, not yet at scale |
| ESM-3 + Flamingo | ESM-3 → Perceiver → Gated cross-attention at LLM layers | ~120-150M | Implemented, not yet at scale |
The training pipeline proceeds in three stages: SSL (continued pre-training on biology literature) → SFT (instruction fine-tuning on protein tasks) → GRPO (reinforcement learning with verifiable rewards).
Scaling Data: 50K → 4.9 Million Samples
Our first 50K-sample run proved the architecture converges. But one data source wasn't enough. We assembled 4.89 million instruction pairs from six sources, anchored by Mol-Instructions [5].
| Metric | 50K / Qwen3-4B | 4.89M / Qwen3-8B | Change |
|---|---|---|---|
| eval_loss | 3.64 | 0.361 | -90.1%* |
| BLEU (best) | — | 0.315 | first measurement |
| ROUGE-L (best) | — | 0.515 | first measurement |
*This comparison spans both a model change (4B→8B) and data change (50K→4.89M). On the same 8B model, data scaling alone gave an 81% reduction (1.91→0.361).
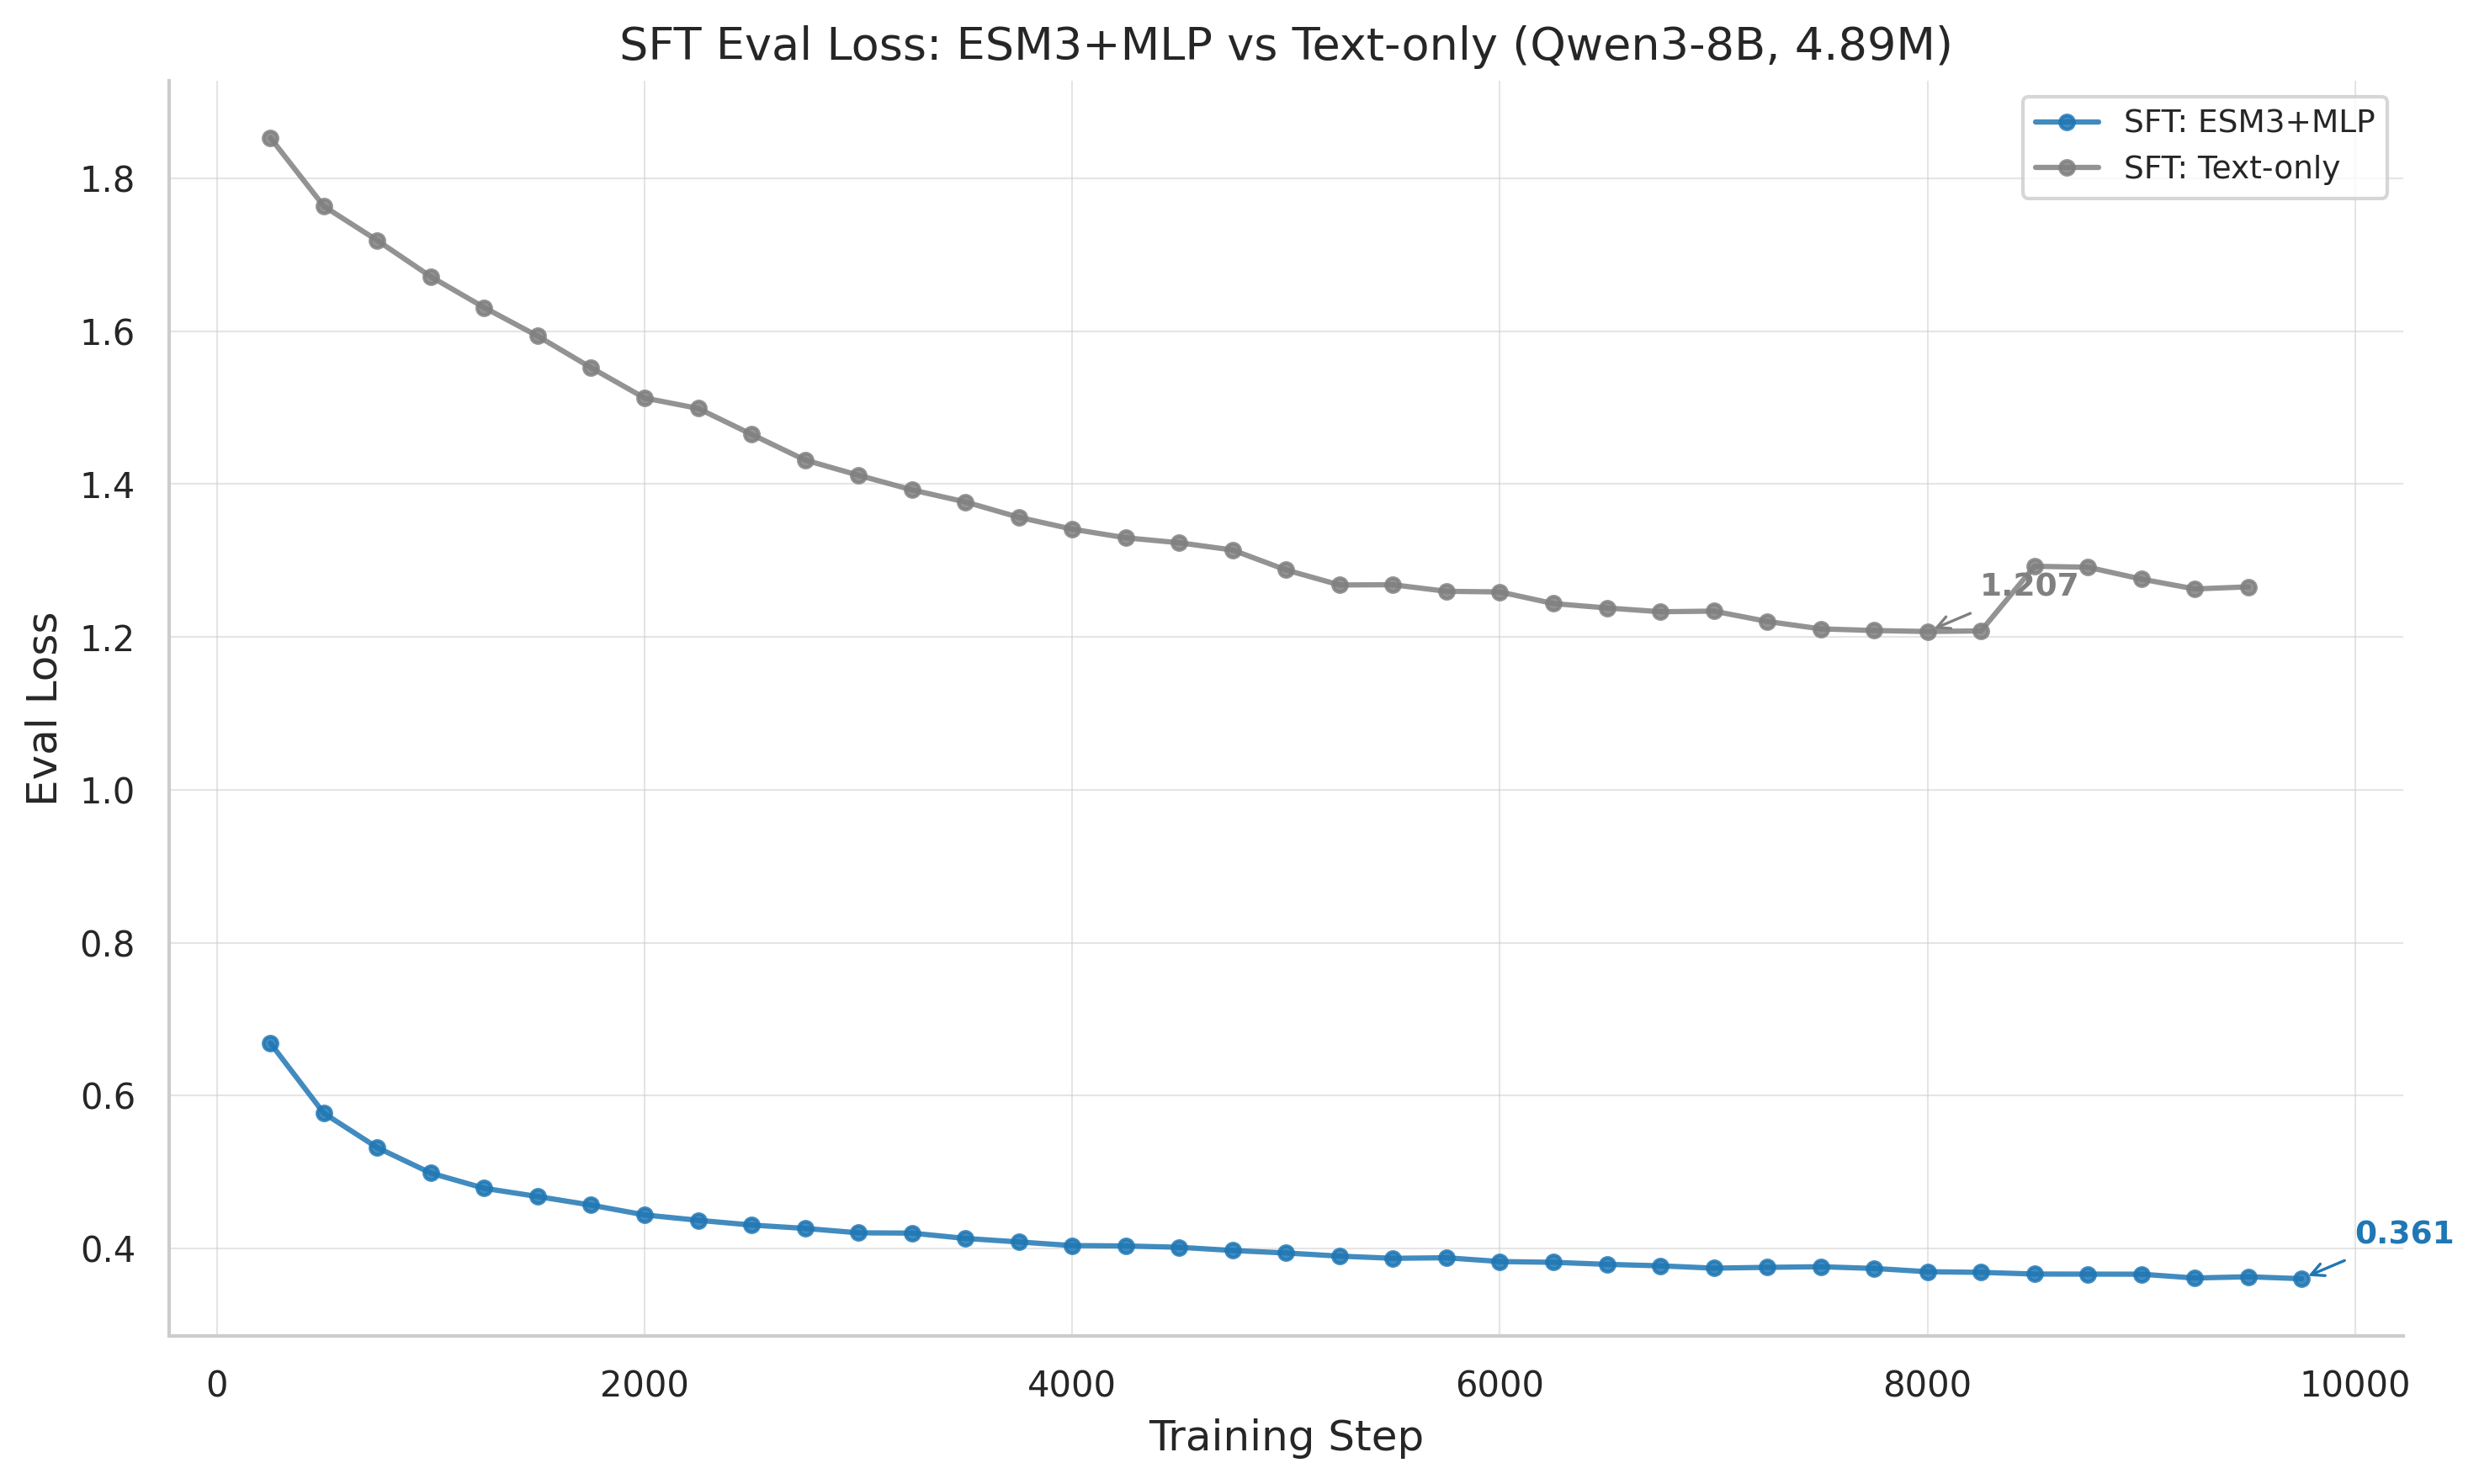
SFT eval loss: ESM-3+MLP (0.361) dramatically outperforms text-only (1.207), demonstrating the value of structural embeddings for supervised learning.
The 4.89M dataset was later refined to 1.82M samples after discovering protein overlap between train and evaluation splits. The eval_loss numbers above may be inflated by this leakage.
Reinforcement Learning: The Gradient Routing Problem
With a strong SFT checkpoint in hand, we applied GRPO [6] using verifiable rewards. Then came the surprise — the rankings completely inverted:
| Model | SFT eval_loss | GRPO Reward (best) |
|---|---|---|
| ESM-3+MLP | 0.361 (better) | 0.780 (worse) |
| Text-only | 1.207 (worse) | 0.832 (better) |
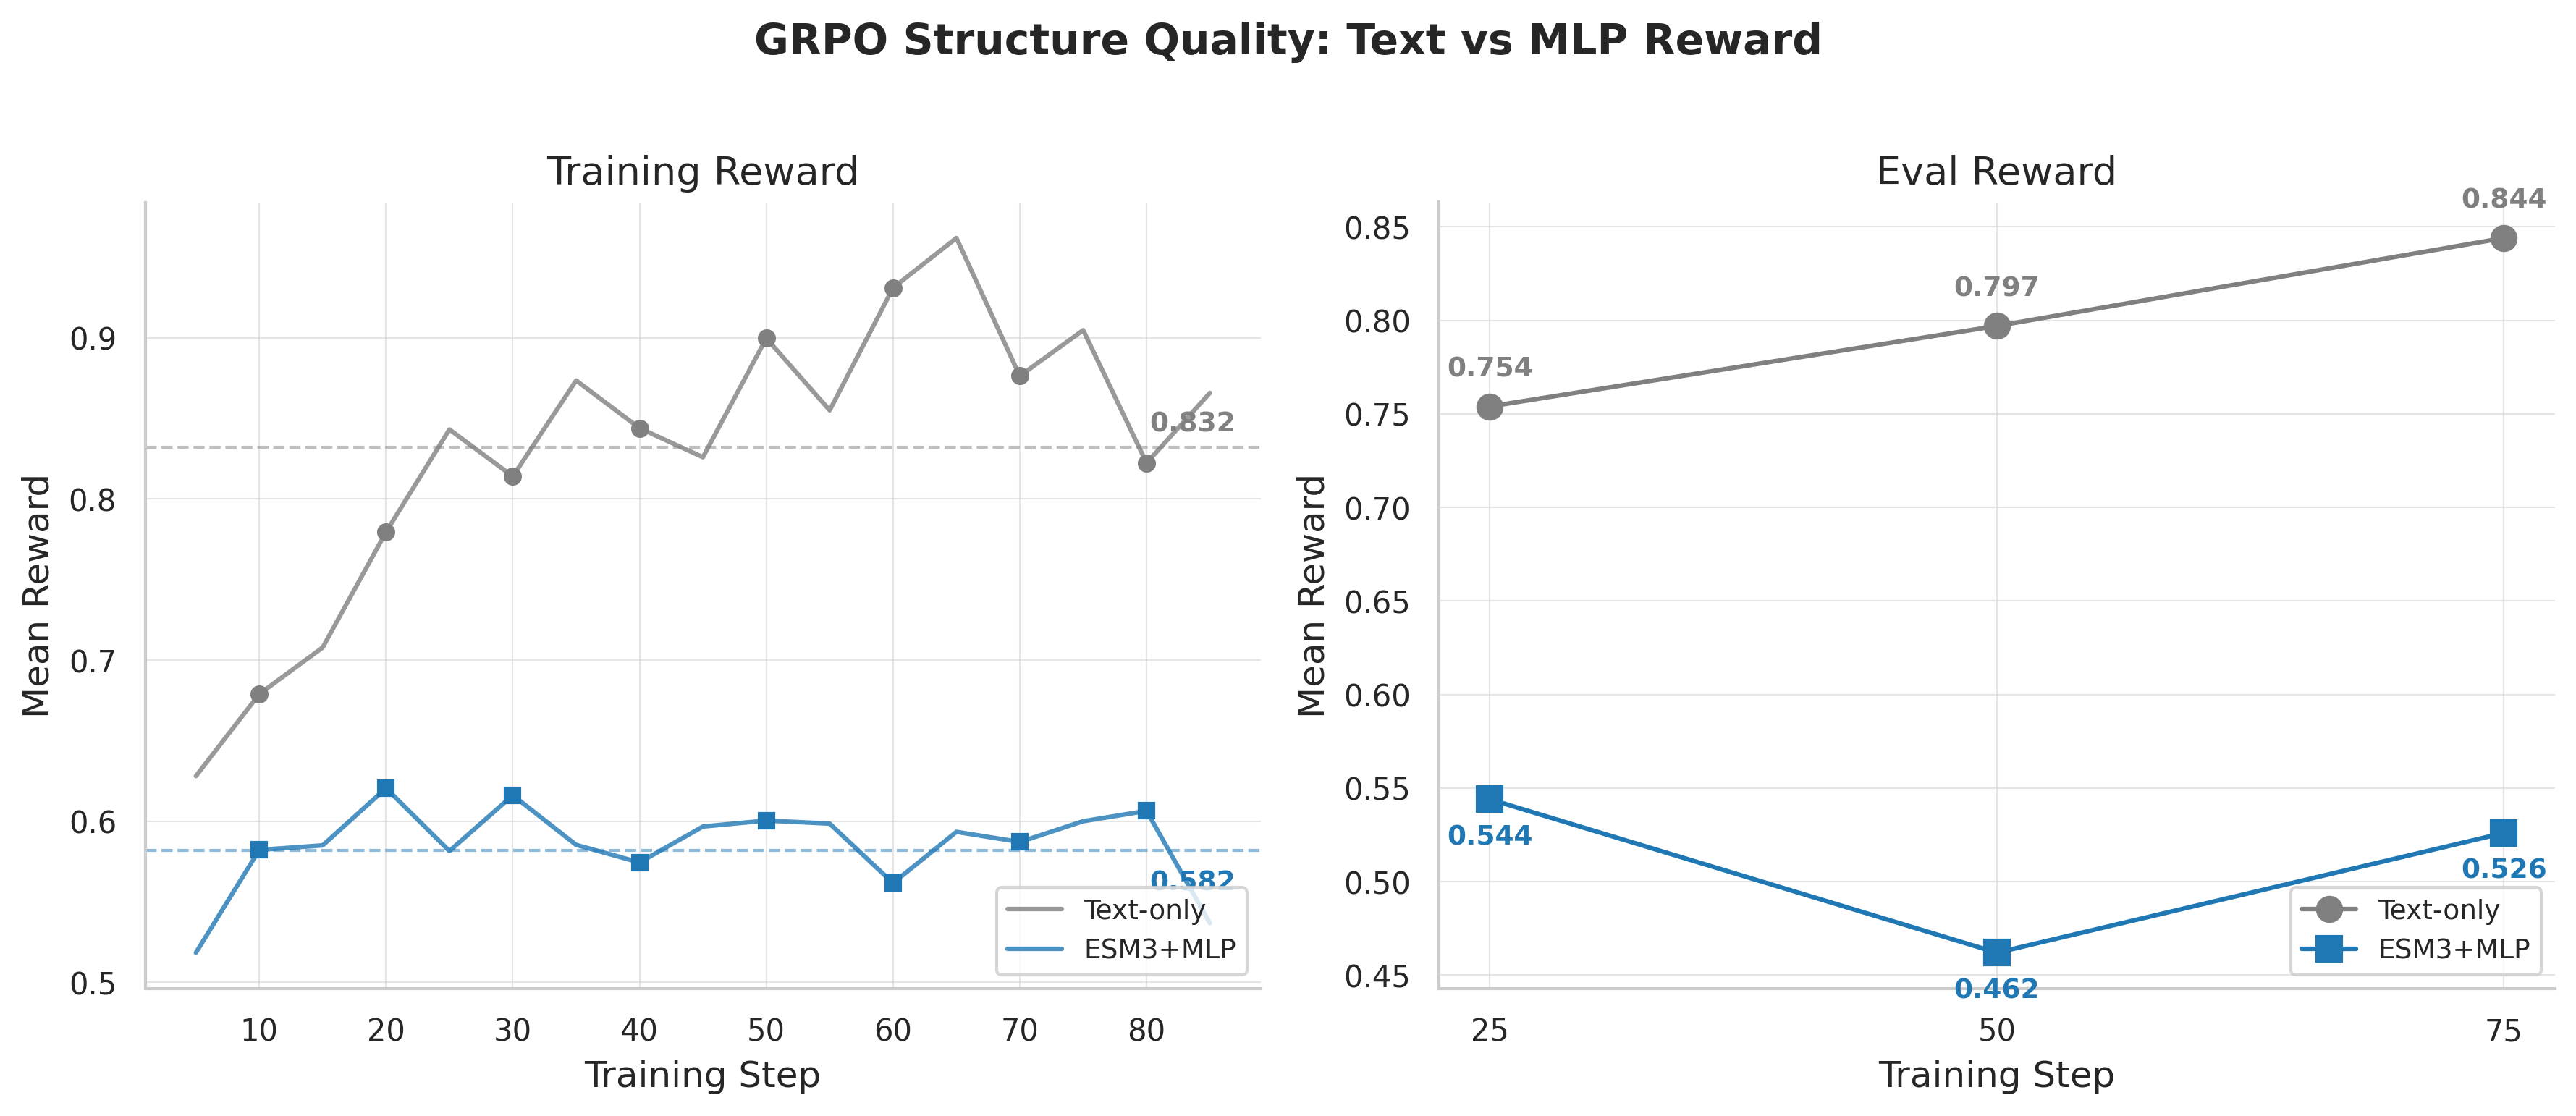
GRPO reward curves: text-only (0.832) outperforms ESM-3+MLP (0.582-0.780), completely inverting the SFT ranking.
The gradient routing problem: During GRPO, gradients flow predominantly to either the projector OR the LoRA adapters — not both effectively. SFT's dense per-token loss flows naturally through the entire graph; GRPO's sparse scalar reward creates competition.
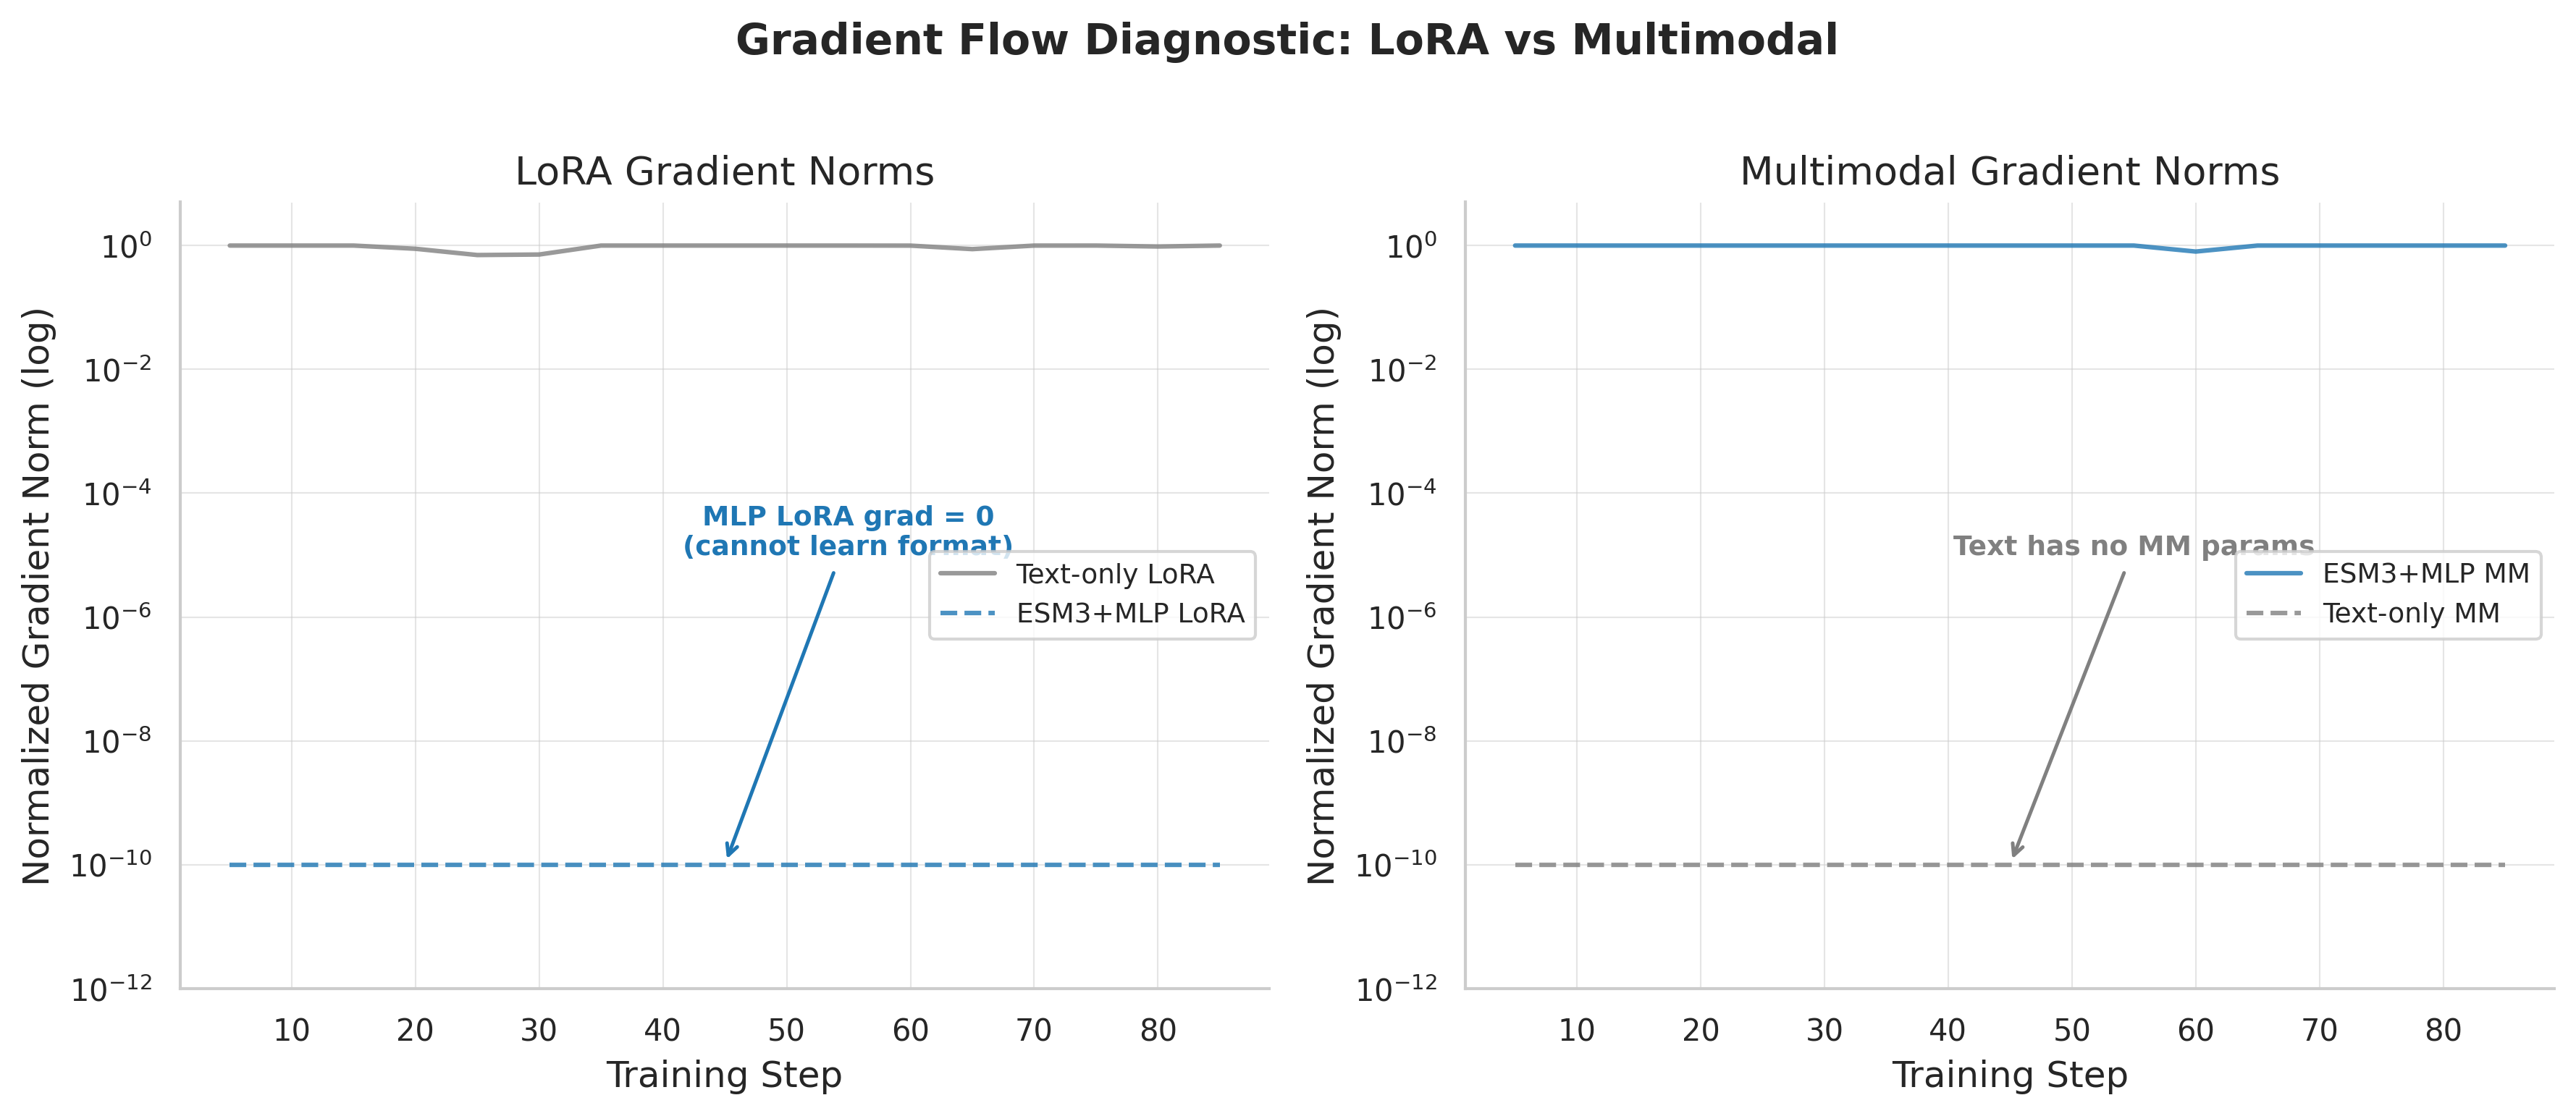
Gradient norms reveal the routing problem: one subsystem captures the RL signal, starving the other — a winner-take-all dynamic.
What's Next
SSL: Domain Pre-Training
Continued pre-training on 50GB of biology literature using Qwen3-4B BASE with LoRA to inject biological domain knowledge before instruction tuning.
Perceiver & Flamingo at Scale
Both architectures are implemented but untested at 4.89M scale. Cross-attention (Perceiver) may exhibit different gradient routing during GRPO.
Resolving the Gradient Routing Problem
- Two-stage GRPO — freeze projector first, then unfreeze
- Gradient balancing — GradNorm or PCGrad
- Architectural solutions — Perceiver/Flamingo may route gradients differently
Timeline
| Date | Phase | Key Result |
|---|---|---|
| Feb 2026 | Architecture & first training | ESM-3+MLP converges; 50K SFT eval_loss=3.64 |
| Mar 7 | Data scaling | 4.89M samples; eval_loss 0.361 (-90.1%) |
| Mar 13 | GRPO reinforcement learning | Gradient routing problem; text 0.832 vs MLP 0.780 |
| Mar 16 | SSL pipeline & curated data | 50GB SSL corpus + 1.82M curated SFT dataset |
| TBD | Four-way comparison | Text vs MLP vs Perceiver vs Flamingo at scale |
| TBD | Gradient routing fix | Two-stage GRPO / gradient balancing |
References
- Hayes, T., Rao, R., Akin, H., et al. “Simulating 500 million years of evolution with a language model.” bioRxiv, 2024. doi:10.1101/2024.07.01.600583
- Liu, H., Li, C., Wu, Q., & Lee, Y. J. “Visual Instruction Tuning.” NeurIPS, 2023. arXiv:2304.08485
- Alayrac, J.-B., Donahue, J., Luc, P., Miech, A., Barr, I., et al. “Flamingo: a Visual Language Model for Few-Shot Learning.” NeurIPS, 2022. arXiv:2204.14198
- Hu, E. J., Shen, Y., Wallis, P., Allen-Zhu, Z., Li, Y., Wang, S., Wang, L., & Chen, W. “LoRA: Low-Rank Adaptation of Large Language Models.” ICLR, 2022. arXiv:2106.09685
- Fang, Y., Liang, X., Zhang, N., Liu, K., Huang, R., Chen, Z., Fan, X., & Chen, H. “Mol-Instructions: A Large-Scale Biomolecular Instruction Dataset for Large Language Models.” ICLR, 2024. arXiv:2306.08018
- Shao, Z., Wang, P., Zhu, Q., Xu, R., Song, J., et al. “DeepSeekMath: Pushing the Limits of Mathematical Reasoning in Open Language Models.” arXiv, 2024. arXiv:2402.03300
- Jaegle, A., Gimeno, F., Brock, A., Zisserman, A., Vinyals, O., & Carreira, J. “Perceiver: General Perception with Iterative Attention.” ICML, 2021. arXiv:2103.03206
- Qwen Team. “Qwen3 Technical Report.” 2025. qwenlm.github.io
BibTeX
@article{hayes2024esm3,
  title={Simulating 500 million years of evolution with a language model},
  author={Hayes, Thomas and Rao, Roshan and Akin, Halil and others},
  journal={bioRxiv},
  year={2024},
  doi={10.1101/2024.07.01.600583}
}

@inproceedings{liu2023llava,
  title={Visual Instruction Tuning},
  author={Liu, Haotian and Li, Chunyuan and Wu, Qingyang and Lee, Yong Jae},
  booktitle={NeurIPS},
  year={2023}
}

@inproceedings{alayrac2022flamingo,
  title={Flamingo: a Visual Language Model for Few-Shot Learning},
  author={Alayrac, Jean-Baptiste and Donahue, Jeff and Luc, Pauline and Miech, Antoine and Barr, Iain and others},
  booktitle={NeurIPS},
  year={2022}
}

@inproceedings{hu2022lora,
  title={LoRA: Low-Rank Adaptation of Large Language Models},
  author={Hu, Edward J and Shen, Yelong and Wallis, Phillip and Allen-Zhu, Zeyuan and Li, Yuanzhi and Wang, Shean and Wang, Lu and Chen, Weizhu},
  booktitle={ICLR},
  year={2022}
}

@inproceedings{fang2024mol,
  title={Mol-Instructions: A Large-Scale Biomolecular Instruction Dataset for Large Language Models},
  author={Fang, Yin and Liang, Xiaozhuan and Zhang, Ningyu and Liu, Kangwei and Huang, Rui and Chen, Zhuo and Fan, Xiaohui and Chen, Huajun},
  booktitle={ICLR},
  year={2024}
}

@article{shao2024deepseekmath,
  title={DeepSeekMath: Pushing the Limits of Mathematical Reasoning in Open Language Models},
  author={Shao, Zhihong and Wang, Peiyi and Zhu, Qihao and Xu, Runxin and Song, Junxiao and others},
  journal={arXiv preprint arXiv:2402.03300},
  year={2024}
}

@inproceedings{jaegle2021perceiver,
  title={Perceiver: General Perception with Iterative Attention},
  author={Jaegle, Andrew and Gimeno, Felix and Brock, Andrew and Zisserman, Andrew and Vinyals, Oriol and Carreira, Joao},
  booktitle={ICML},
  year={2021}
}

@misc{qwen2025qwen3,
  title={Qwen3 Technical Report},
  author={{Qwen Team}},
  year={2025},
  howpublished={\url{https://qwenlm.github.io/blog/qwen3/}}
}
Part 1: Building a Protein-Understanding LLM — Trials, Errors, and Breakthroughs (Feb 25, 2026)
The Beginning: Why This Project?
It started with a simple observation. Protein language models like ESM-3 have learned remarkably rich representations from millions of protein sequences — structural features, evolutionary constraints, functional signals — all encoded in high-dimensional embeddings. Meanwhile, LLMs excel at reasoning, following instructions, and generating coherent explanations. But they exist in separate worlds.
The question that kept nagging me: what if we could bridge these two worlds?
Not by training a protein model from scratch (prohibitively expensive), but by post-training — freezing the protein encoder, attaching a learnable bridge, and teaching an LLM to interpret protein embeddings alongside natural language.
Day 1: Architecture Decisions
The Core Design
We settled on a modular pipeline:
- Protein Encoder (frozen): ESM-3 small with 1.4B parameters producing 1536-dimensional embeddings
- Attention Pooling: Compress variable-length residue embeddings into 32 fixed tokens
- MLP Projector (trainable): Map 1536-dim protein space into 2560-dim LLM input space
- LLM: Qwen3-4B with LoRA on all linear layers
Start with 32 pooled tokens. Too few and we lose protein information; too many and we blow up sequence length. 32 seemed like a reasonable middle ground — equivalent to roughly 100 words of text context.
The Three Encoding Approaches
Raw sequence as <protein>MKTL...</protein> — the simplest baseline. No ESM-3, just treating proteins as weird text.
ESM-3 embeddings → Attention Pooling → MLP Projector. Our main approach.
ESM-3 embeddings → Perceiver Resampler. ~29M parameters, with latent_dim decoupling for better information compression.
We later added a fourth approach — Flamingo-style gated cross-attention — bringing the comparison to four pathways.
Day 2: First Training Run — It Works!
The Mol-Instructions Dataset
We started with Mol-Instructions, a curated set of 505K protein instruction pairs:
| Task | Samples | Description |
|---|---|---|
| Catalytic Activity | 53K | Predict enzyme reactions |
| Protein Function | 114K | Predict biological roles |
| General Description | 87K | Describe protein properties |
| Domain/Motif | 45K | Identify structural domains |
| Protein Design | 196K | Generate sequences |
First Results
| Run | Samples | Loss (Start → End) | Duration |
|---|---|---|---|
| 500-sample test | 500 | 17.35 → 4.08 | ~6 min |
| 10K baseline | 10,000 | 35.80 → 27.84 | ~96 min |
| 50K full | 50,000 | 34.25 → 14.77 | ~2.35 hr |
The training converged. On 8x H100 80GB GPUs, the 50K run used only ~39 GB memory with an effective batch size of 32.
Day 2-3: The Evaluation Reality Check
The vanilla Qwen3-4B set a floor — essentially random performance:
- GO Term Prediction: F1 Micro = 0.047
- PPI Prediction: AUROC = 0.51 (literally random)
- Stability Prediction: Pearson r = 0.094
After SFT, the numbers didn't improve much. Some got worse.
GO prediction degraded after SFT. The vanilla model at least guessed some correct terms. After SFT, the model predicted too few terms (or none at all). F1 went from 0.047 to 0.0.
The PPI Bias Problem
All models defaulted to predicting "No interaction" for every protein pair. High specificity (0.9-1.0), terrible recall (0.2 or 0.0). The silver lining: AUROC improved with scale (0.51 → 0.60 → 0.70), suggesting better internal representations.
What This Told Us
- The architecture works — training converges, memory is manageable
- SFT alone isn't enough — instruction-tuning doesn't automatically teach structured output
- Scale helps internal representations — the knowledge is there, it just doesn't surface in generation
Day 4: The Instruct Model Disaster
We launched an 8B training run overnight. Loss looked fine. But generation was garbage:
KQKQKQKQKQKQKQKQ...
SSSSSSSSSSSSSSSS...
(empty string)
After hours of debugging: the config had path: Qwen/Qwen3-8B — the base model, not Qwen/Qwen3-8B-Instruct-2507.
Base models don't know how to stop. They never learned instruction-following, chat templates, or turn-taking. The LoRA adapter trained on the base model couldn't be transferred to Instruct. The entire overnight run was wasted.
Fix: All model configs now use -it suffix. A simple naming convention that would have saved 8 hours of H100 time.
Day 4-5: Protein Boundary Tokens
The ESM-3 embedding path used a single <|protein_embed|> placeholder. The LLM had no explicit signal for where the protein representation starts and ends.
Solution — structured boundary tokens:
<|protein_start|>  <|protein_embed|>  <|protein_end|>
     ID 151669         ID 151670          ID 151671
[..., text, START_embed, prot_1, prot_2, ..., prot_32, END_embed, text, ...]
↑ LLM learns ↑ 32 ESM-3 pooled tokens ↑ LLM learns
what this means (replaced at forward) what this meansThe start/end tokens remain as regular LLM embeddings. The middle tokens get replaced by ESM-3's pooled output. All three are masked from loss computation.
Day 6: Scaling Up Data
Why 505K Wasn't Enough
Mol-Instructions covers five tasks well, but they all come from one paper's annotation pipeline. We needed different annotation styles, more tasks, and scale.
The Six Sources
| Source | Records | What It Brings |
|---|---|---|
| Mol-Instructions | 299K | Curated instruction pairs (ICLR 2024) |
| Swiss-Prot | 1.08M | Gene prediction, organism prediction, function |
| ProteinLMDataset | 826K | Subunit, PTM, disease, tissue, induction |
| SwissProtCLAP | 511K | Rich paragraph-length descriptions |
| ProtDescribe | 1.76M | Naming, similarity, location, function |
| Protein2Text-QA | 52K | 44,915 unique questions — highest diversity |
Total: 4.52 million training records.
Sequence Length Distribution
Supplementary: Sequence length distribution & data composition
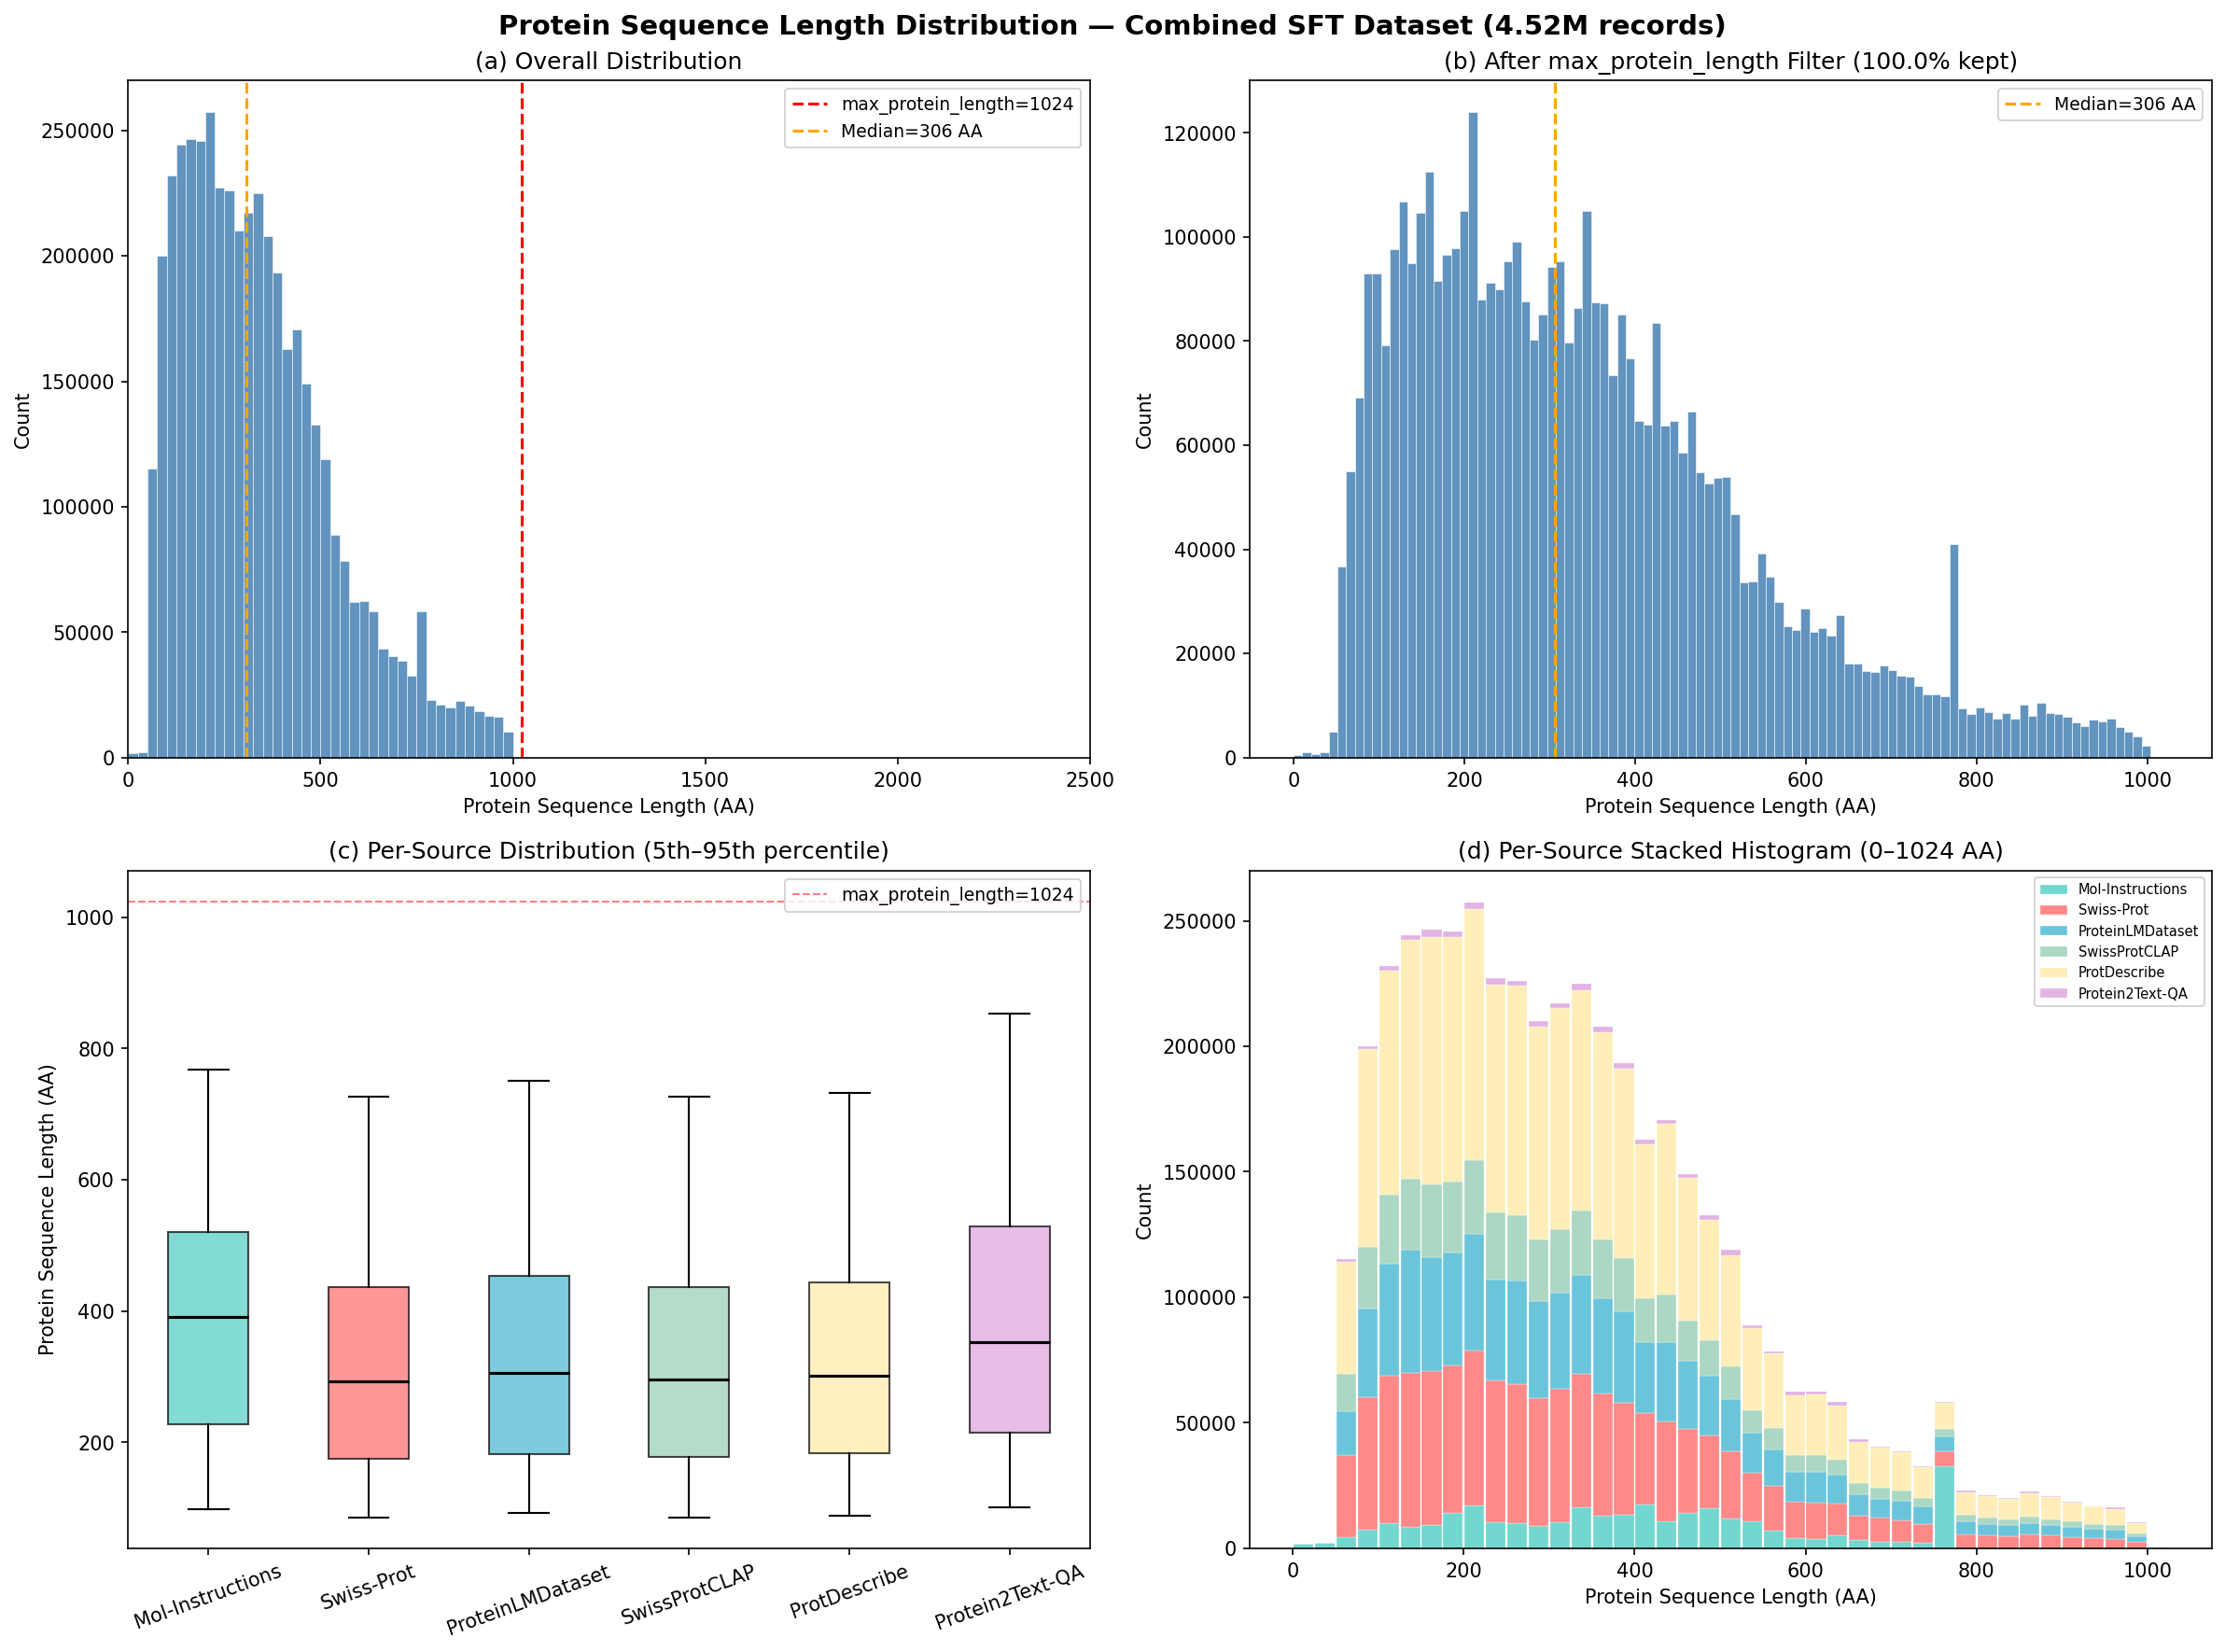
Distribution of protein sequence lengths across the combined 4.5M dataset. Median: 306 amino acids.
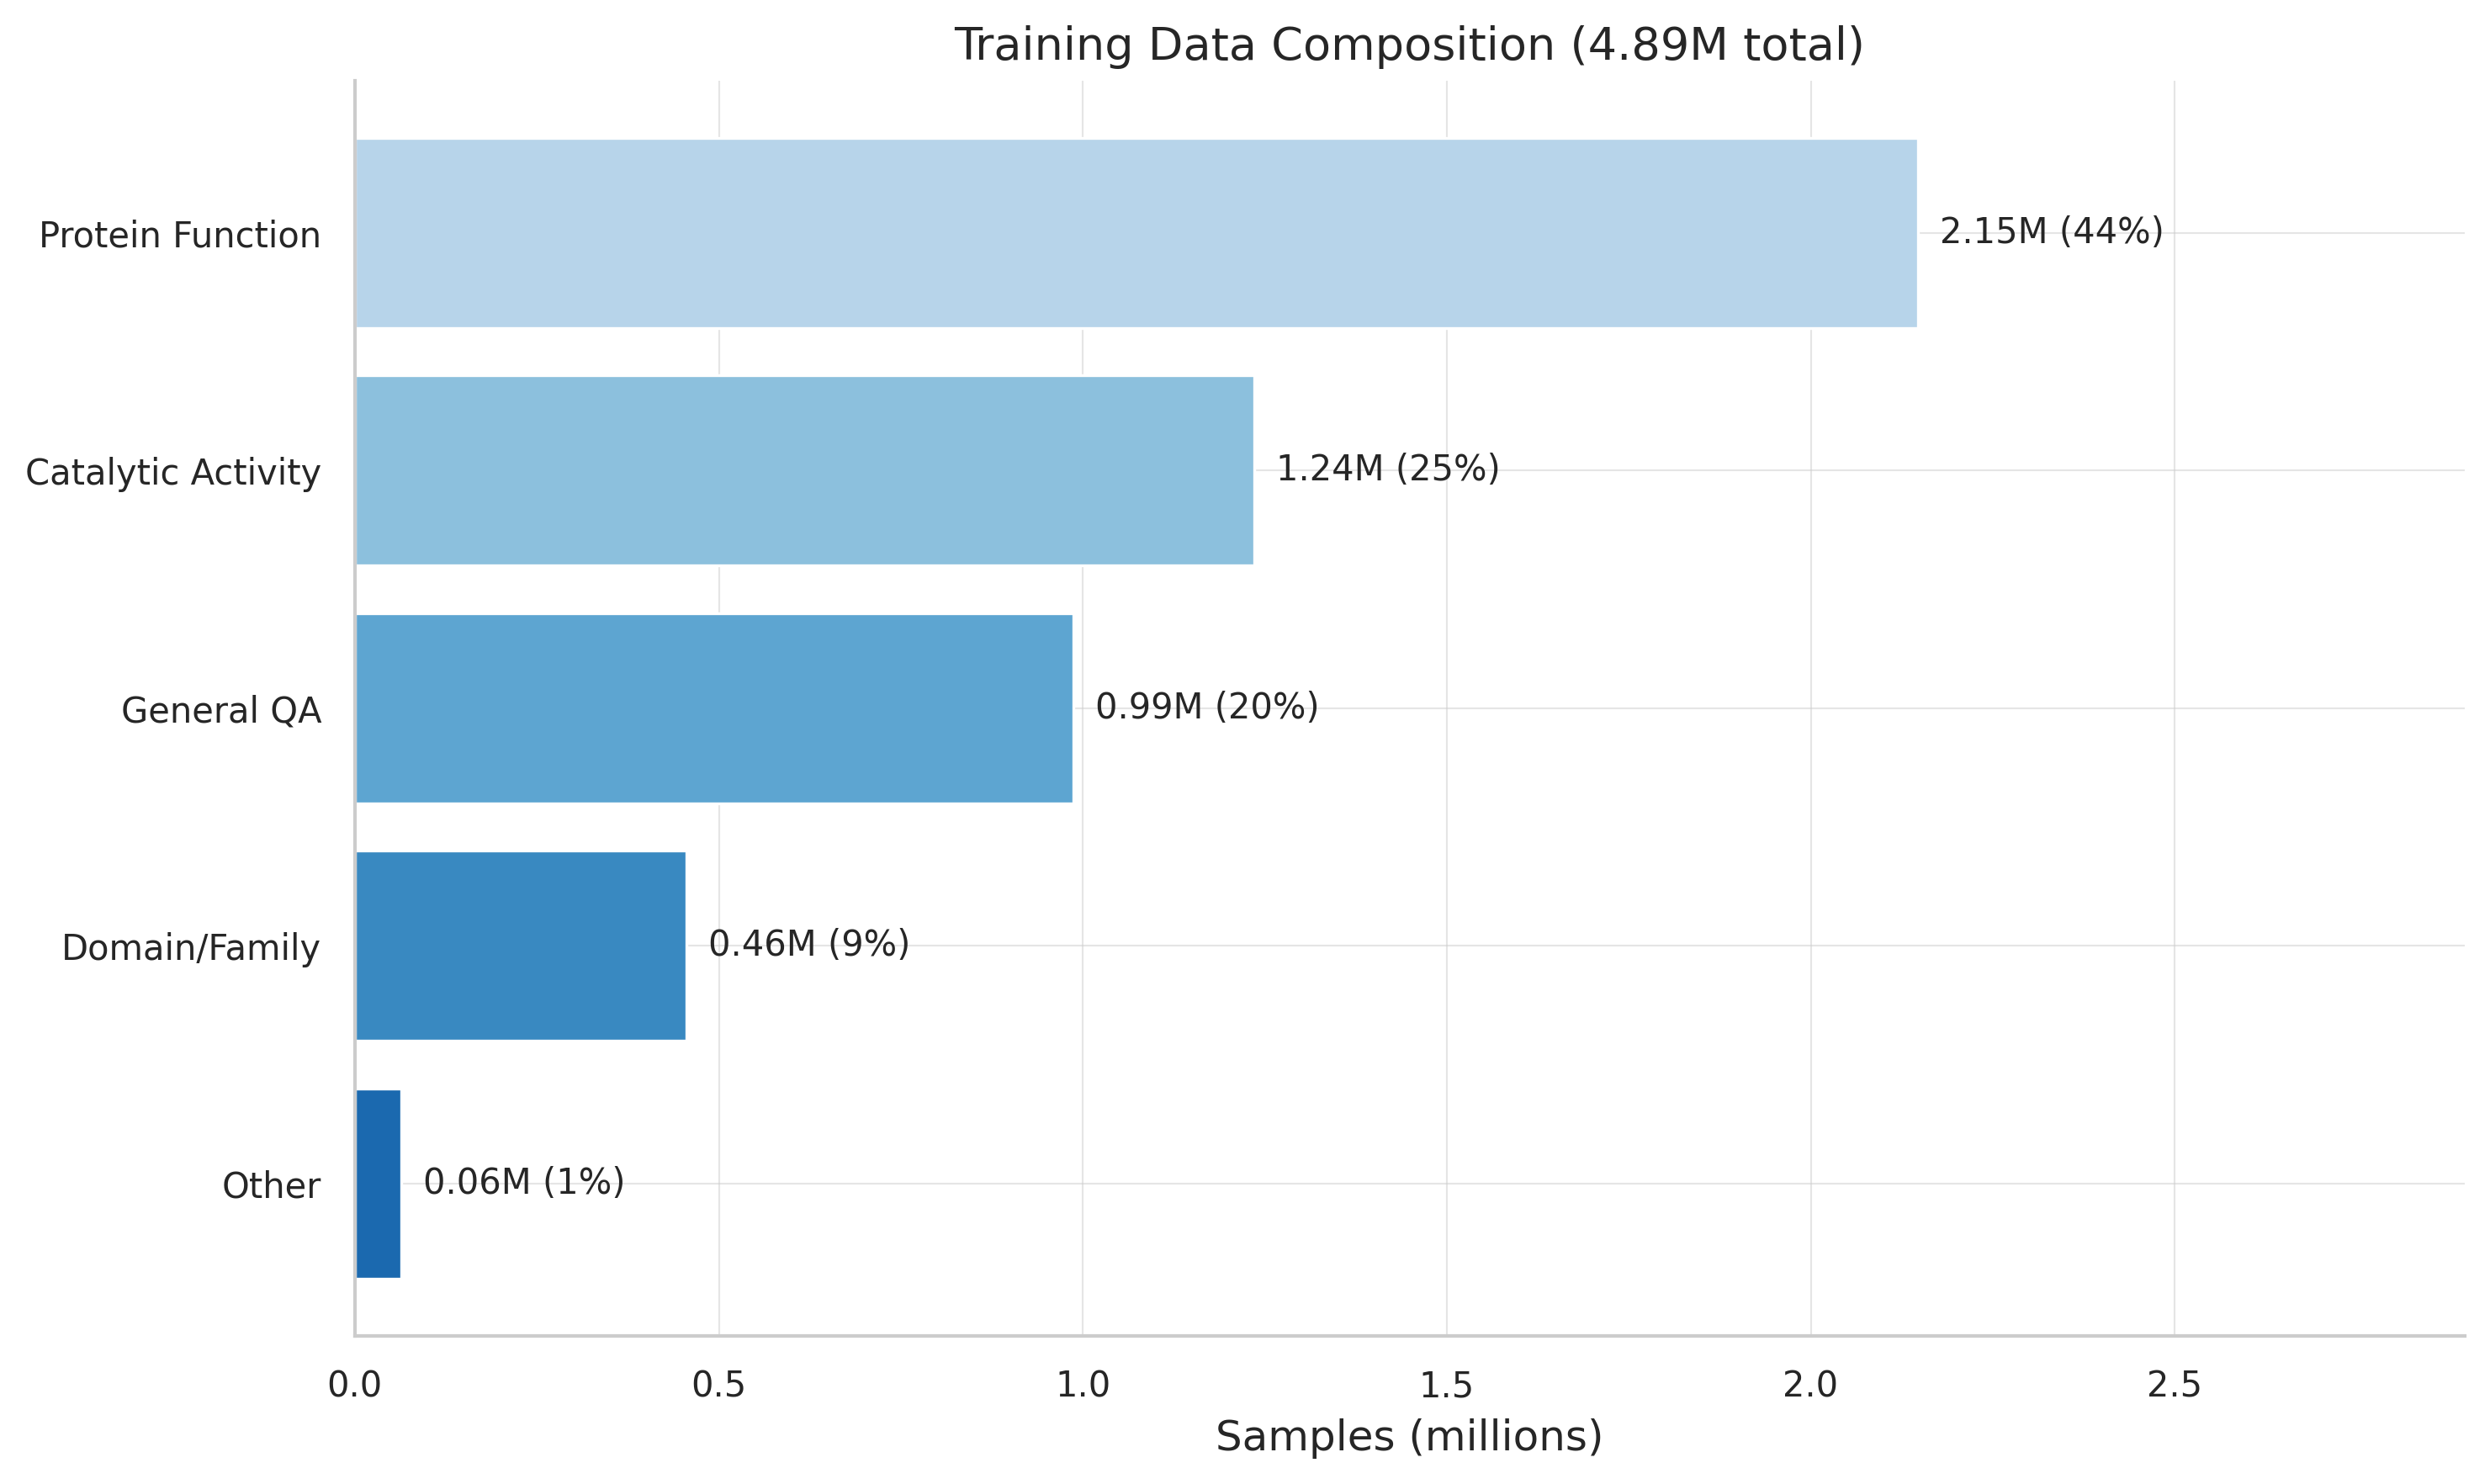
Composition of the 4.89M training dataset across six sources and task types.
| Statistic | Value |
|---|---|
| Median | 306 AA |
| Mean | 339 AA |
| 5th percentile | 89 AA |
| 95th percentile | 751 AA |
| Max | 1,000 AA |
Single-word outputs: 31% of ProteinLMDataset subunit records have outputs like just "Monomer." 12-16% duplicates from template augmentation. 72.8% sequence overlap across sources — same proteins, different analytical contexts.
The RL Path Forward
SFT established the foundation, but we need task-specific rewards to push beyond "reasonable-sounding but wrong." We implemented GRPO with four verifiable reward functions — GO term F1, stability prediction accuracy, PPI interaction detection, and ESMFold structural quality assessment.
Lessons Learned
- Naming conventions save hours. The
-itsuffix on Instruct models would have prevented an overnight disaster. - Evaluation comes first. We spent days on architecture before realizing our evaluation was incomplete.
- SFT is necessary but not sufficient. Task-specific rewards (RL) are needed for downstream metrics.
- Data diversity likely matters alongside scale. 300K from one source → linguistic tics. 4.5M from six sources should help.
- Proteins are hard. Longer than typical text, different statistical properties, domain-specific evaluation.
Part 2: Scaling to 4.9 Million Samples (Mar 7, 2026)
The Scaling Experiment
| What Changed | Before | After |
|---|---|---|
| Training samples | 50K (one source) | 4.89M (six sources) |
| Dataset diversity | 5 task types | 15+ task types |
| Annotation styles | Template-based only | Paragraphs, QA, structured |
| Total training steps | 2,595 | 28,941 |
Everything else stayed constant: Qwen3-8B-Instruct, ESM-3 small (frozen), MLP projector, LoRA on all linear layers, 8x H100 GPUs with FSDP.
The Results
Loss Dropped Off a Cliff
| Metric | Combined 4.9M (MLP) | Text-Only on 4.9M | Mol-Instr Only (505K) |
|---|---|---|---|
| eval_loss | 0.361 | 1.207 | 1.908 |
| token_avg_loss | 0.366 | 1.643 | 2.282 |
| MLP advantage vs text | — | 70.1% lower | 81.1% lower |
Supplementary: Training & eval loss curves
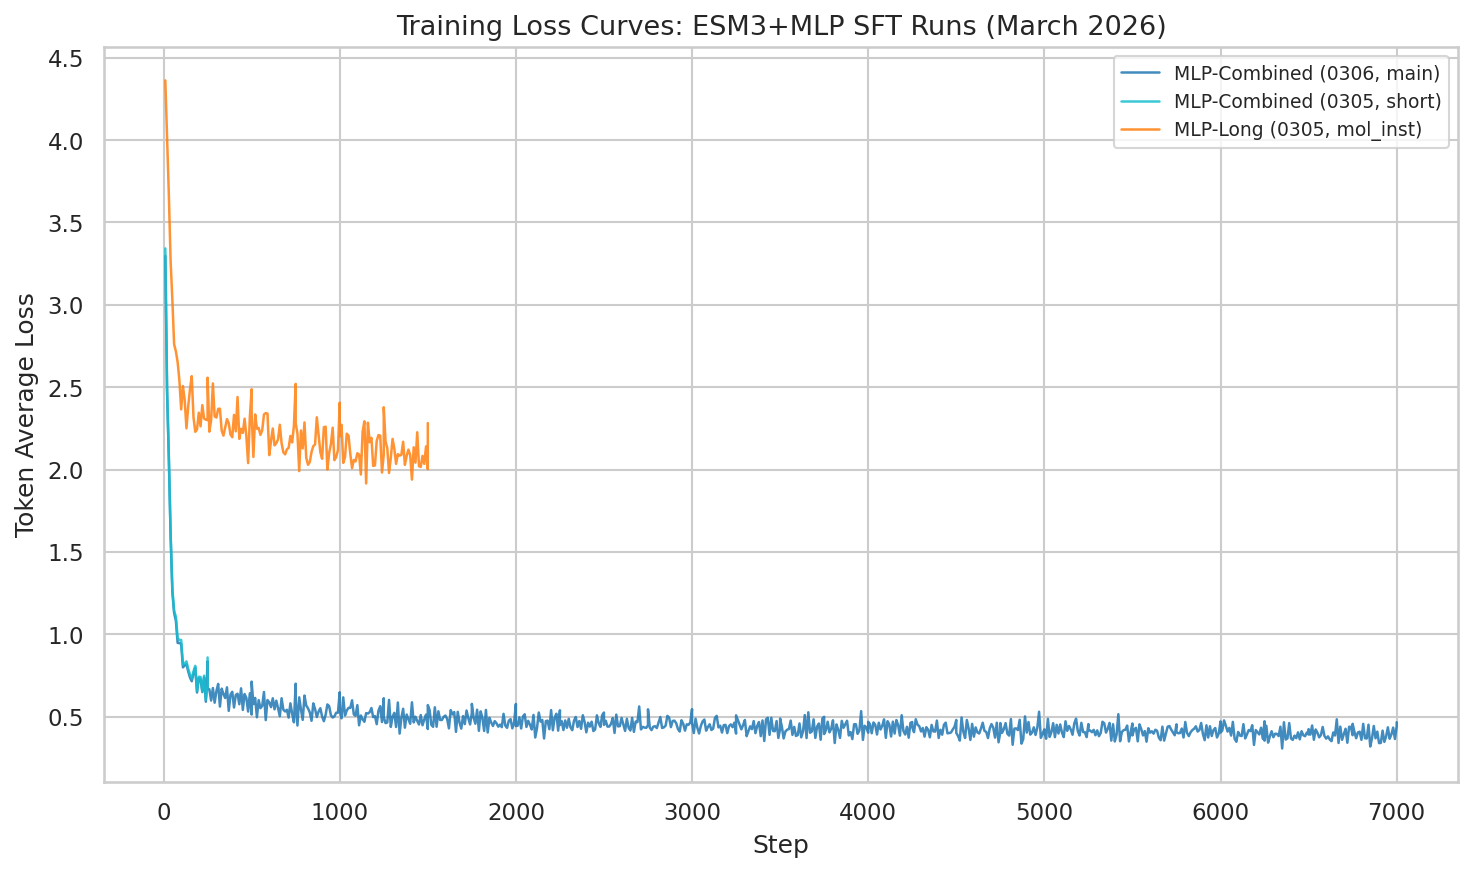
Training loss showing continued improvement through epoch 1. The combined dataset produces dramatically lower loss than single-source training.
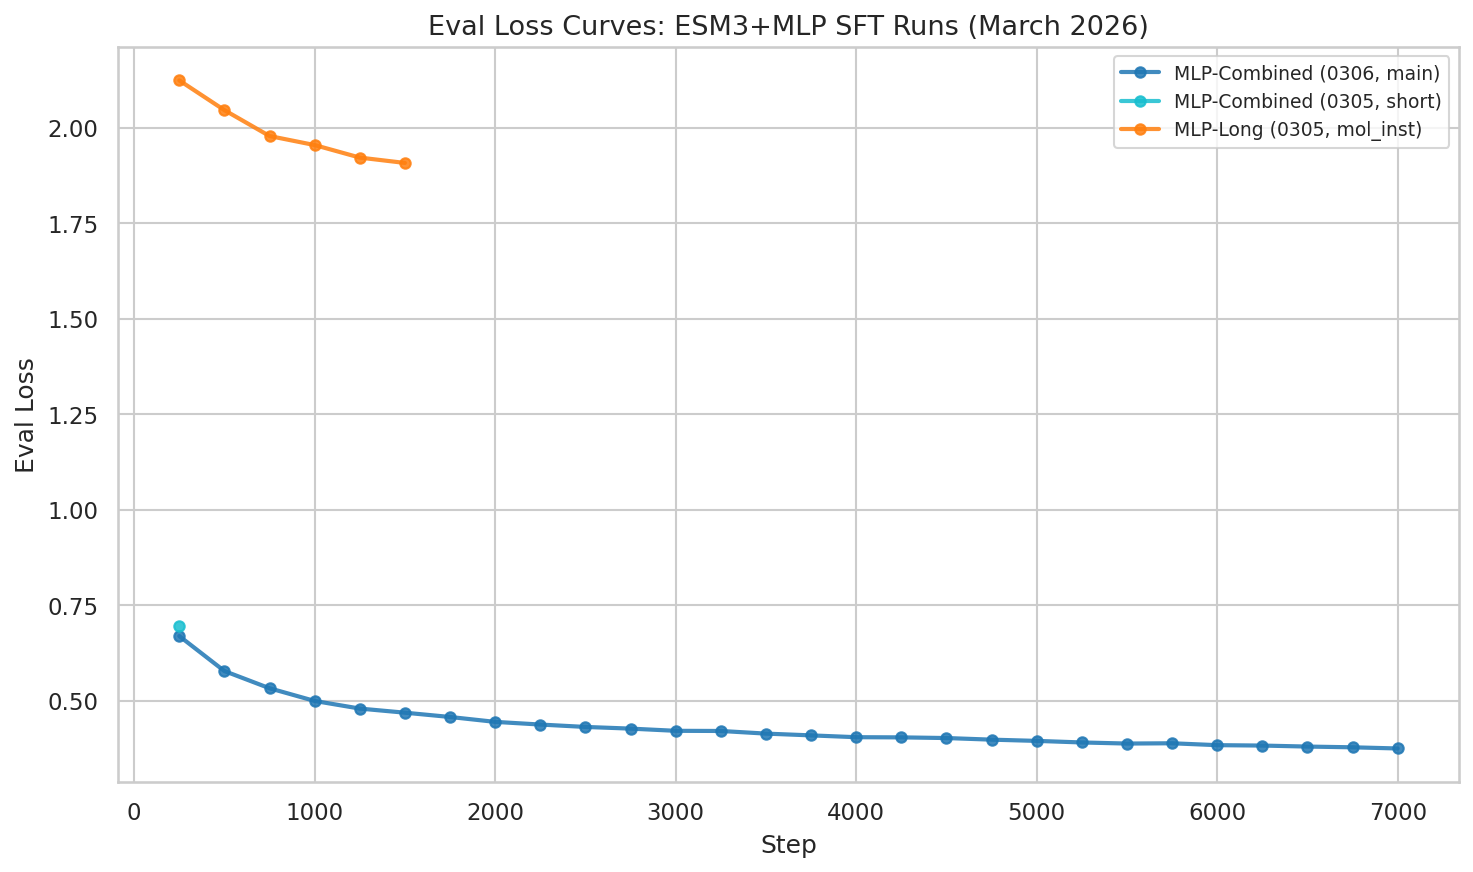
Eval loss at epoch 1 checkpoint: 0.361 — dramatically lower than mol-instructions-only (1.908).
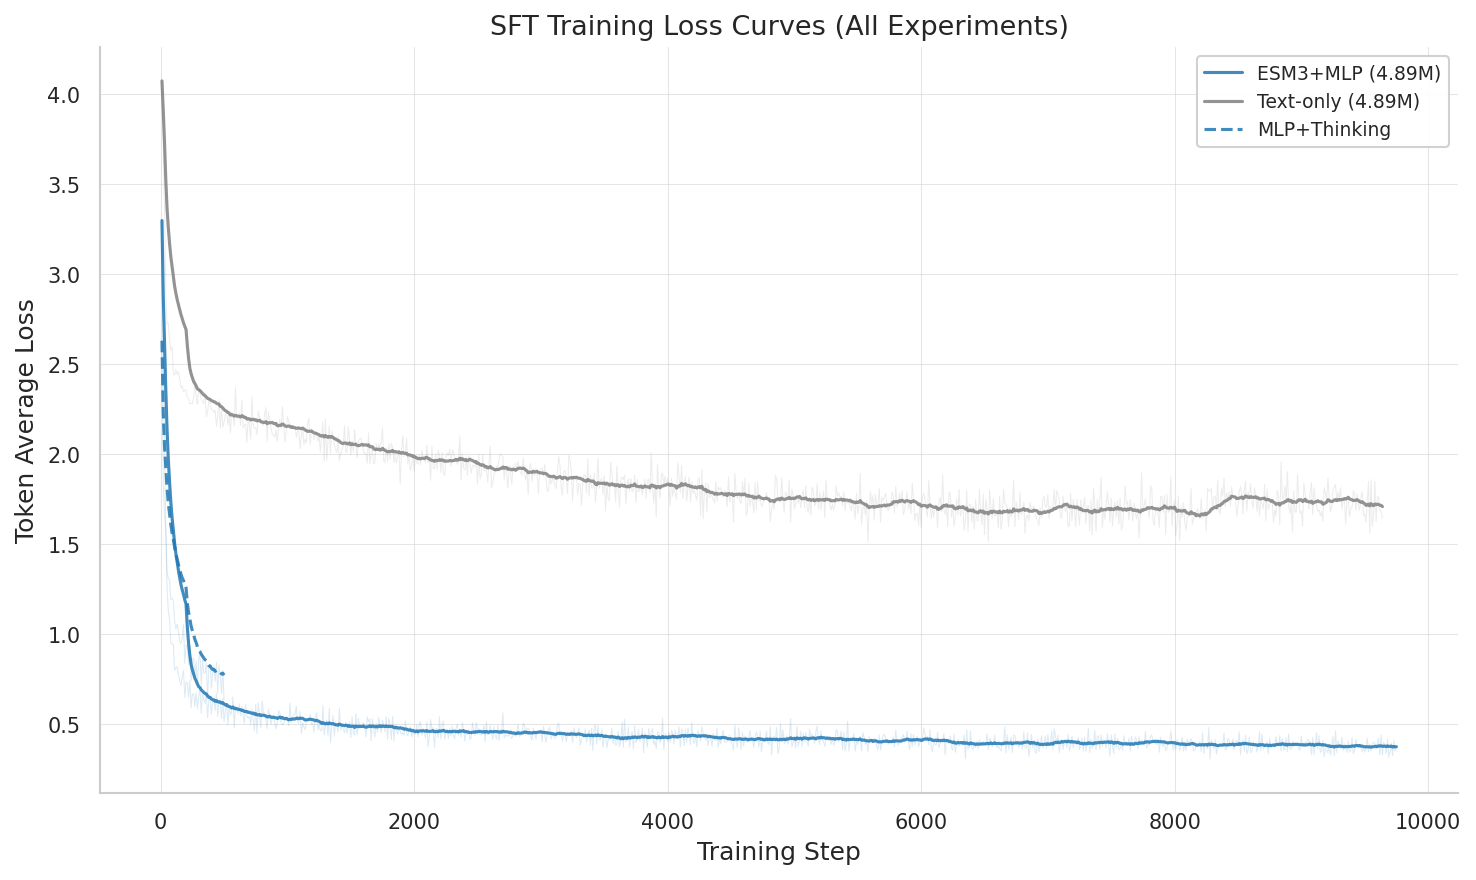
All SFT training runs compared: MLP, text-only, and mol-instructions-only across training steps.
The Two Biggest Levers
| Date | Change | eval_loss | Improvement |
|---|---|---|---|
| Feb 20 | First run (Qwen3-4B, 50K) | 3.64 | baseline |
| Feb 23 | Scale model: 4B → 8B | 1.94 | 47% |
| Feb 27 | Text-only baseline (8B, 505K) | 2.42 | 33% |
| Mar 5 | MLP on full mol-instructions | 1.91 | 48% |
| Mar 7 | Combined 4.89M dataset | 0.361 | 90% |
First Generation Quality Numbers
| Metric | Best Value (step 9,250) |
|---|---|
| BLEU | 0.315 |
| ROUGE-L | 0.515 |
Scores declined slightly by the final checkpoint (step 9,750: BLEU 0.255, ROUGE-L 0.481), suggesting some overfitting.
Supplementary: Scaling effect, generation quality & training stability
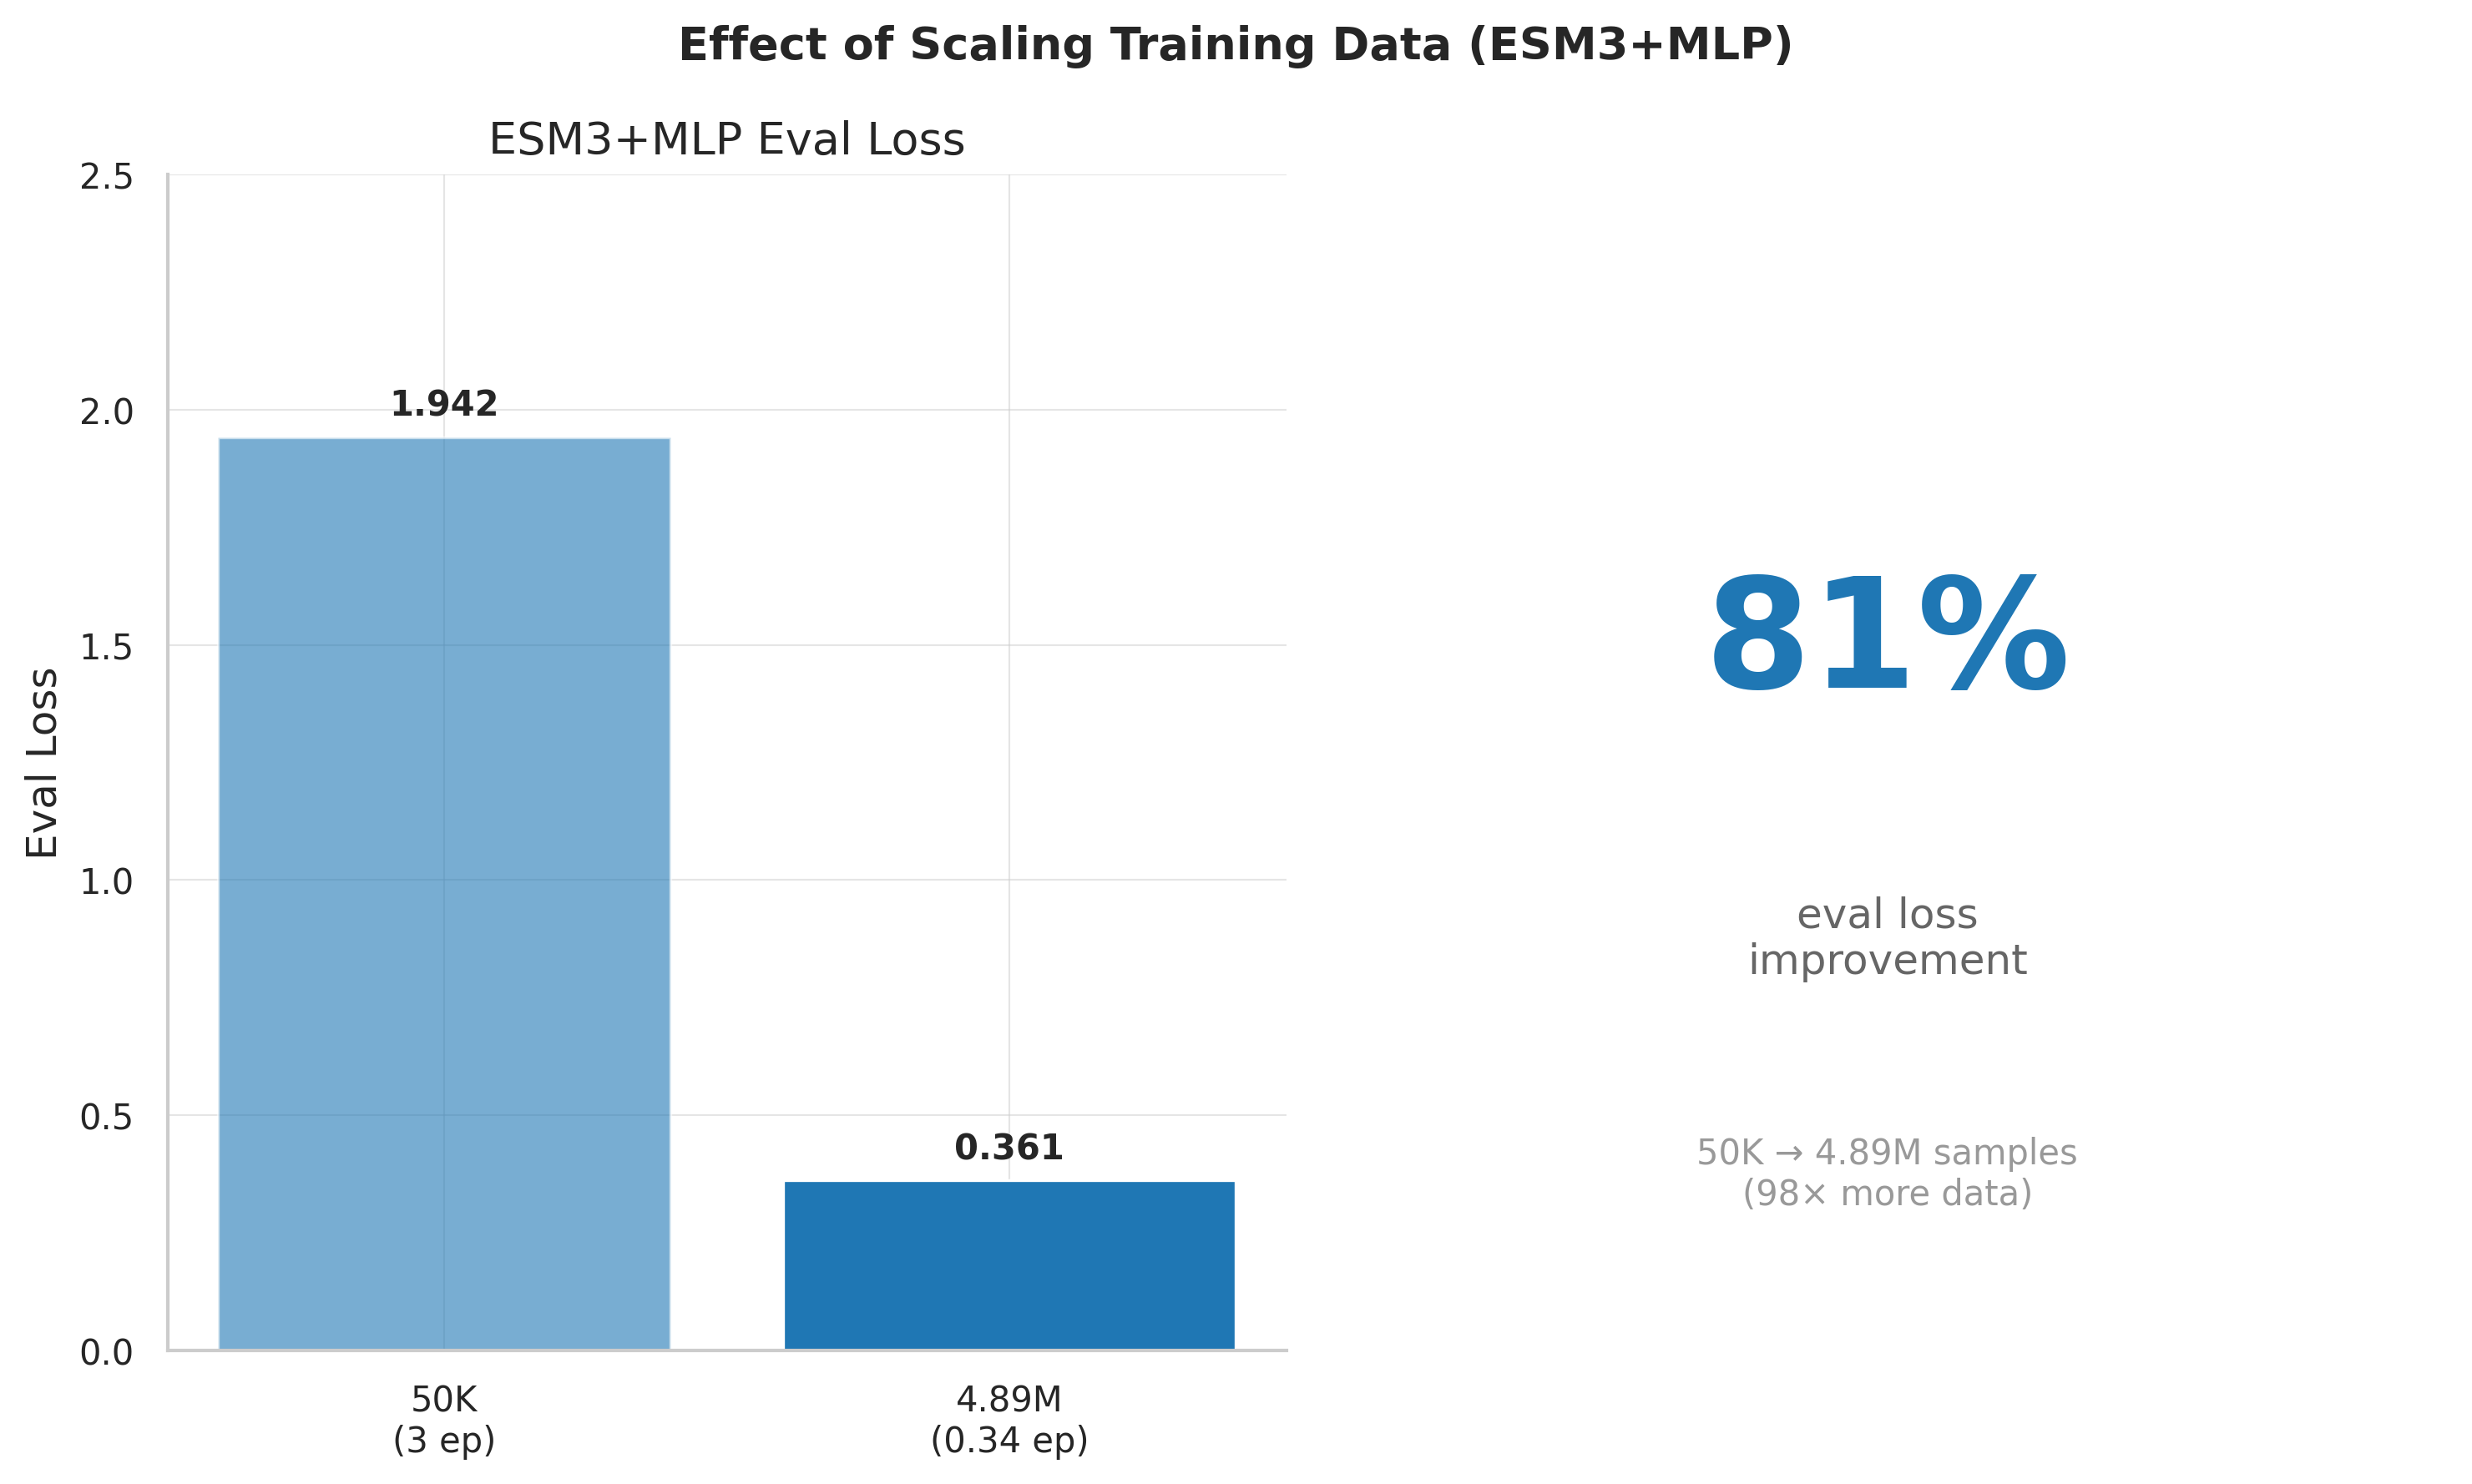
Eval loss as a function of data scale: 50K → 505K → 4.89M. Data scaling provides the largest single improvement.
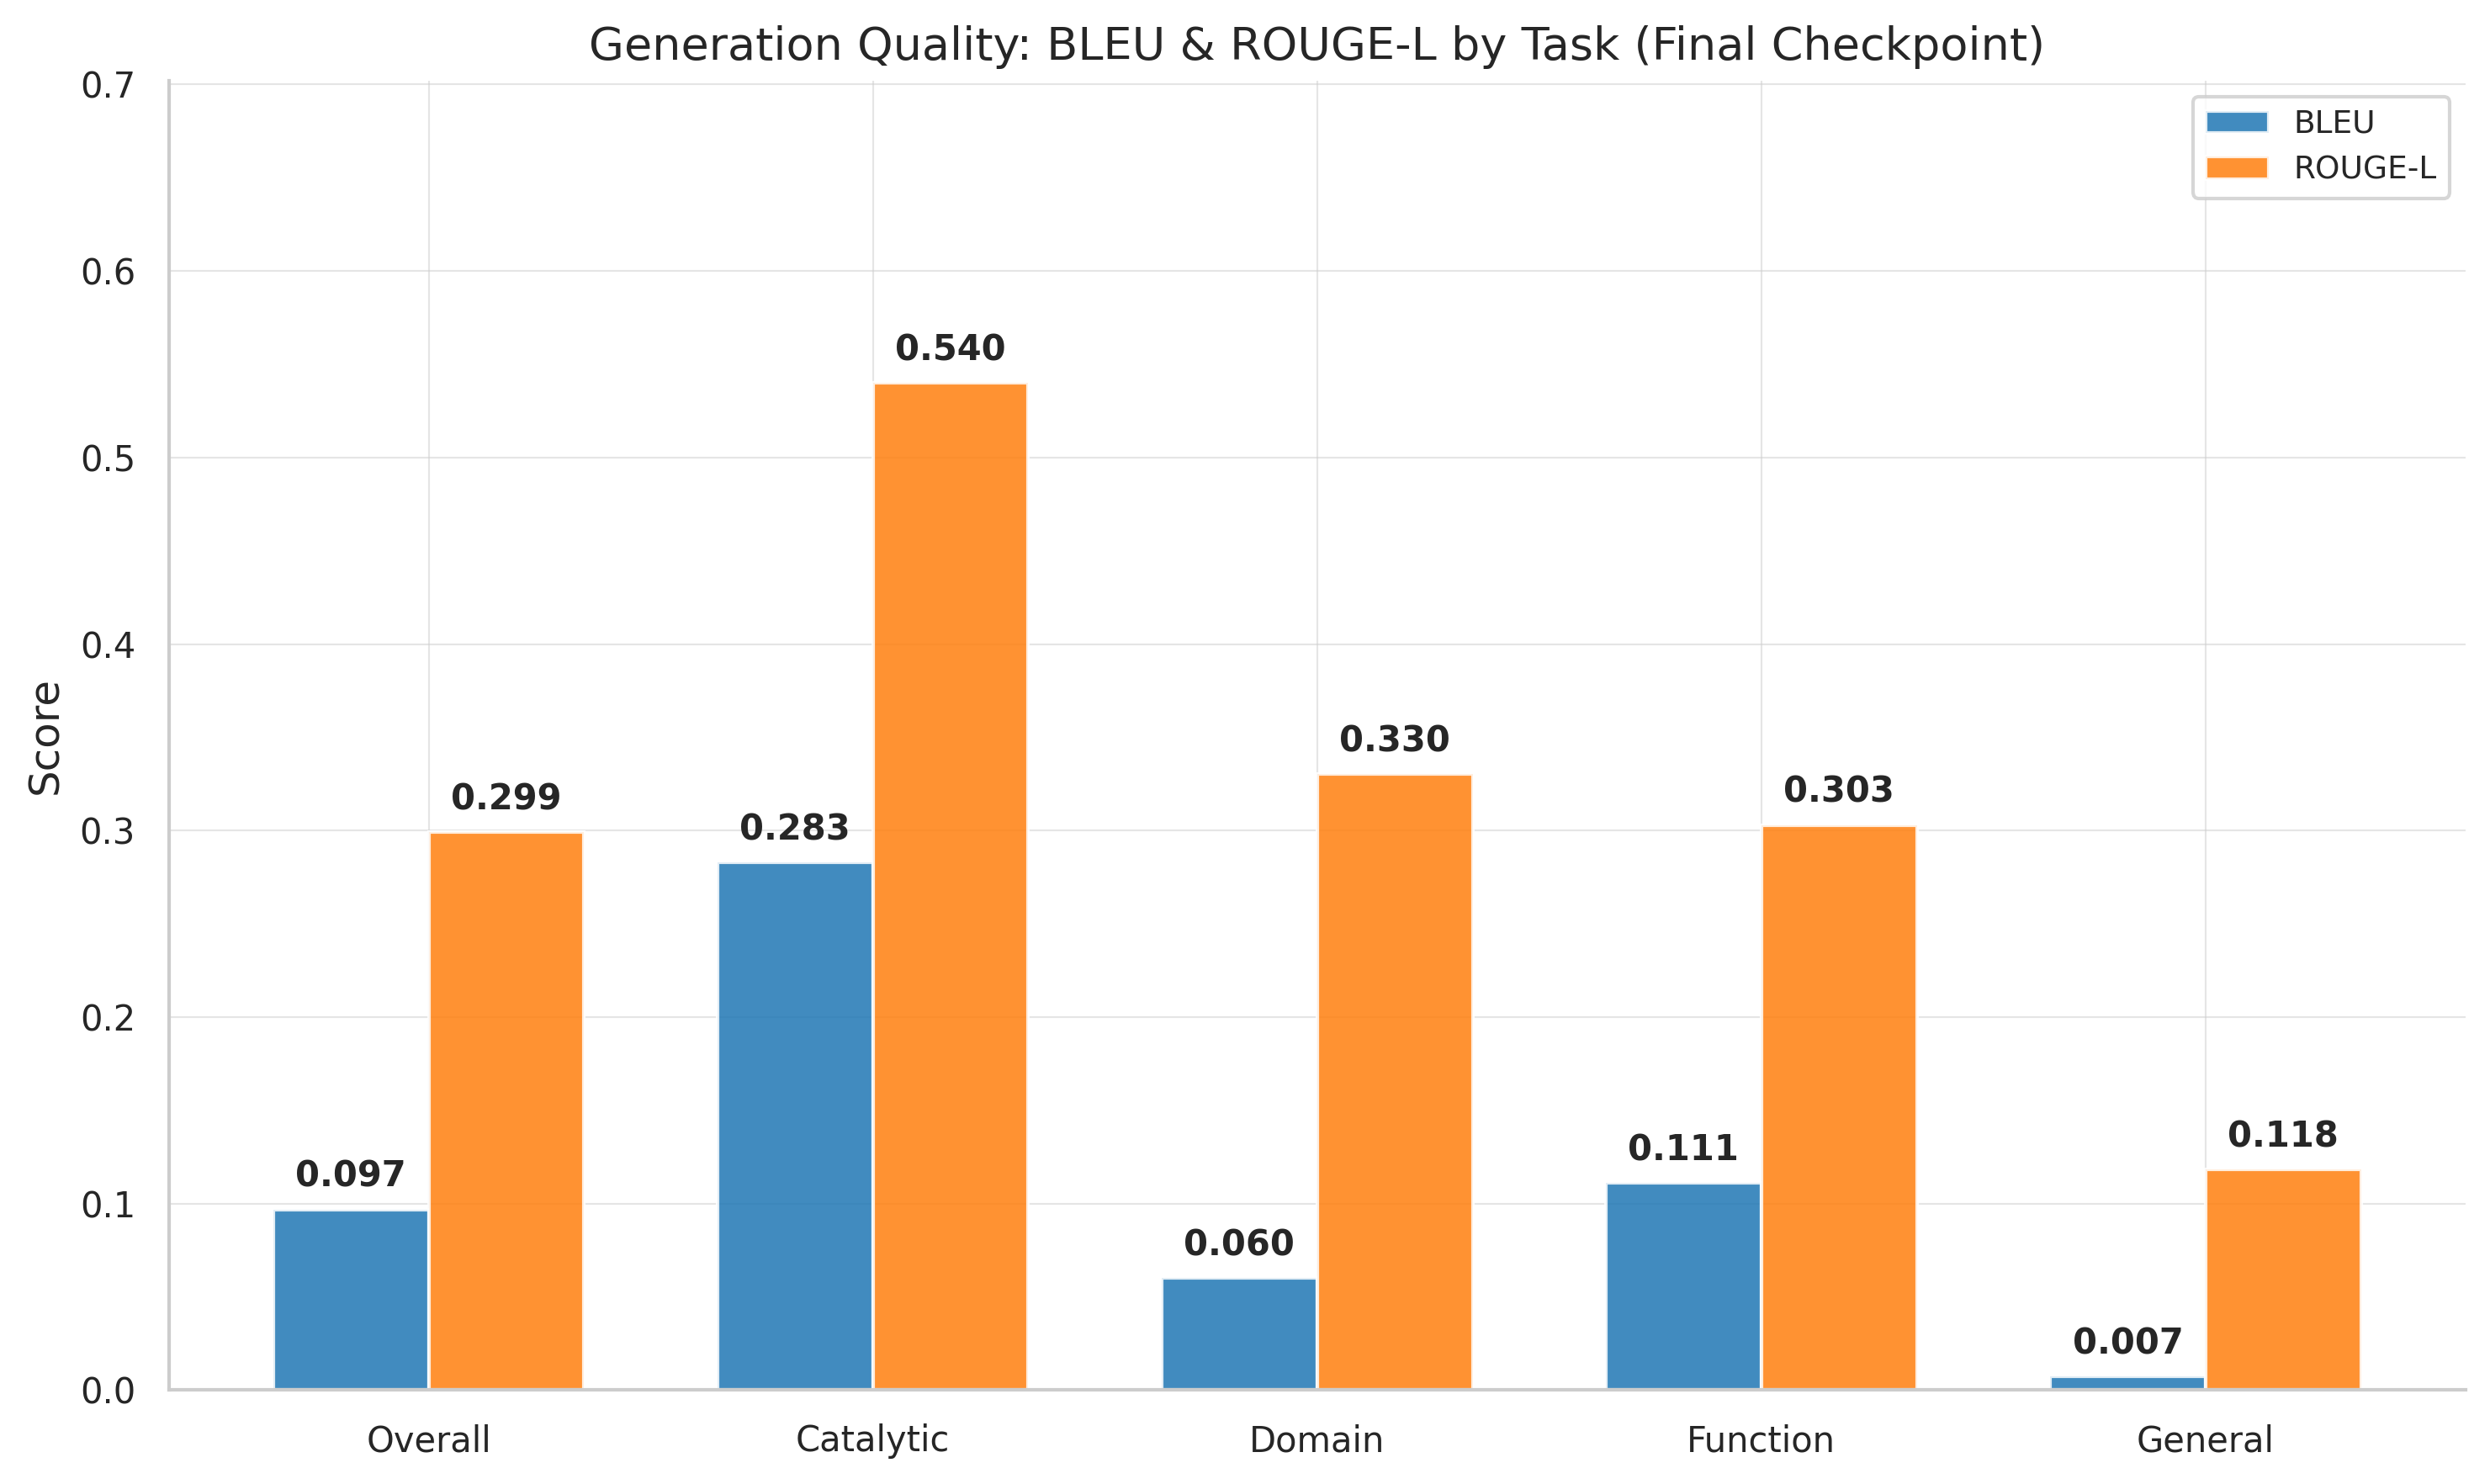
BLEU and ROUGE-L over training steps. Best quality at step 9,250; slight decline afterward suggests overfitting.
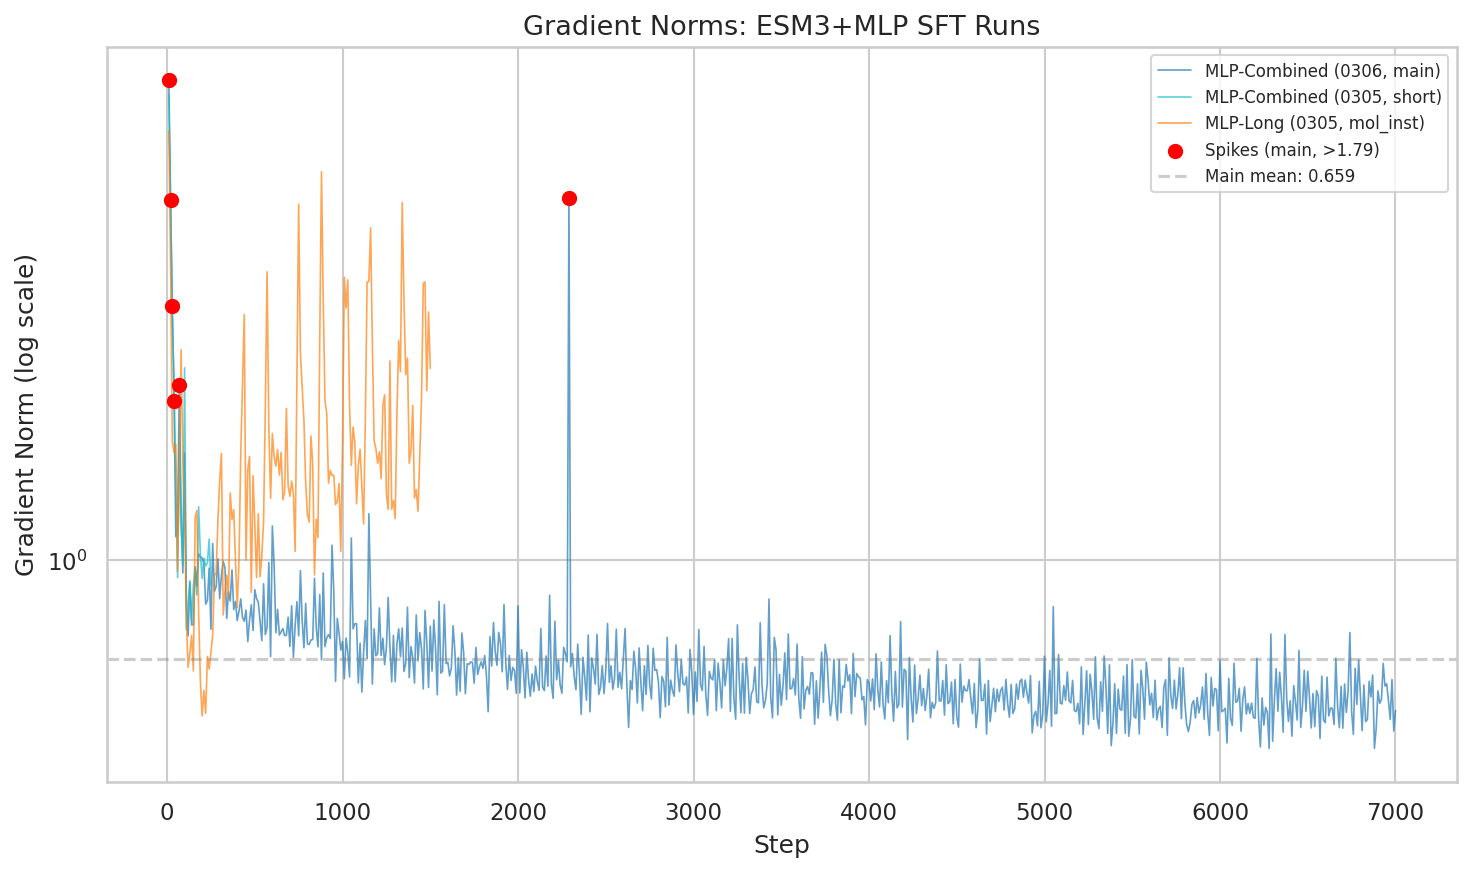
Gradient norm trajectories. The combined run stabilizes to a mean of 0.627 after initial spikes in the first 100 steps.
Brief instability early on (steps 10-100), then rock-solid stability. Mean gradient norm: 0.627 — lower than both mol-instructions-only (1.67) and text baseline (1.48). More diverse data actually made optimization smoother.
Architectural Comparison
On 50K data, MLP and Perceiver achieve nearly identical performance: eval_loss 1.942 vs 1.952 (MLP wins by 0.5%).
| Approach | Projector Params | 50K eval_loss | 4.89M eval_loss |
|---|---|---|---|
| Text-only | — (LoRA only) | 2.415 | 1.207 |
| MLP | 30.5M | 1.942 | 0.361 |
| Perceiver | 29.4M | 1.952 | Not yet run |
| Flamingo | ~120-150M | — | Not yet run |
Supplementary: Embedding space analysis
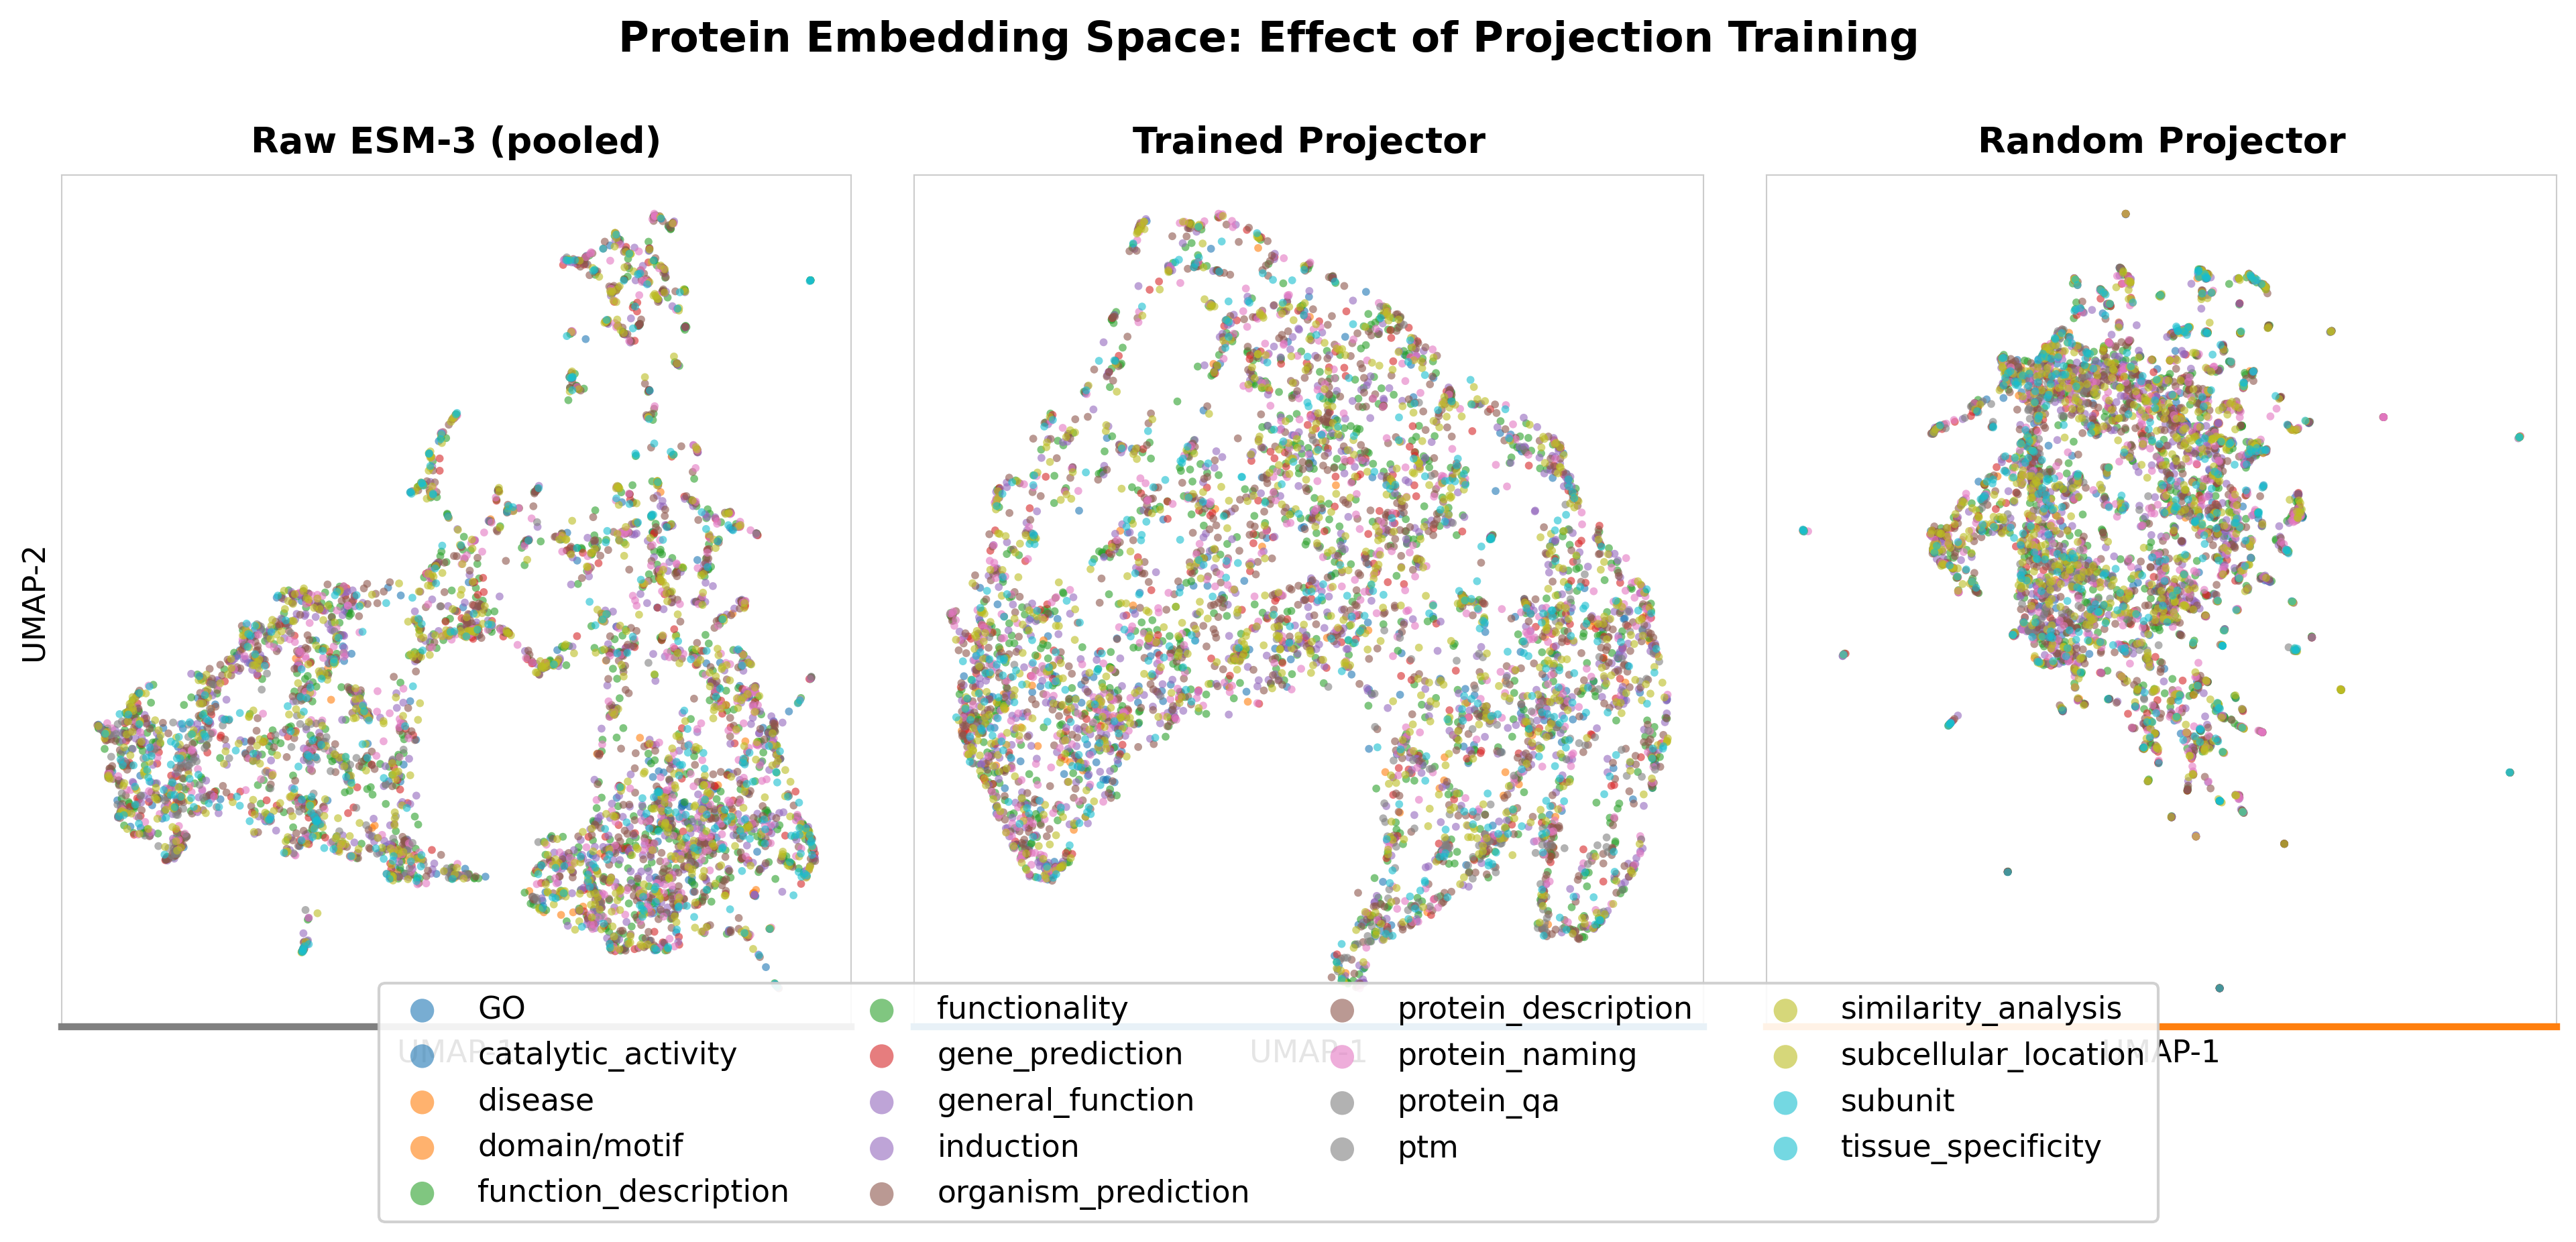
UMAP visualization of protein embeddings: ESM-3 structural space vs LLM representation space after SFT.
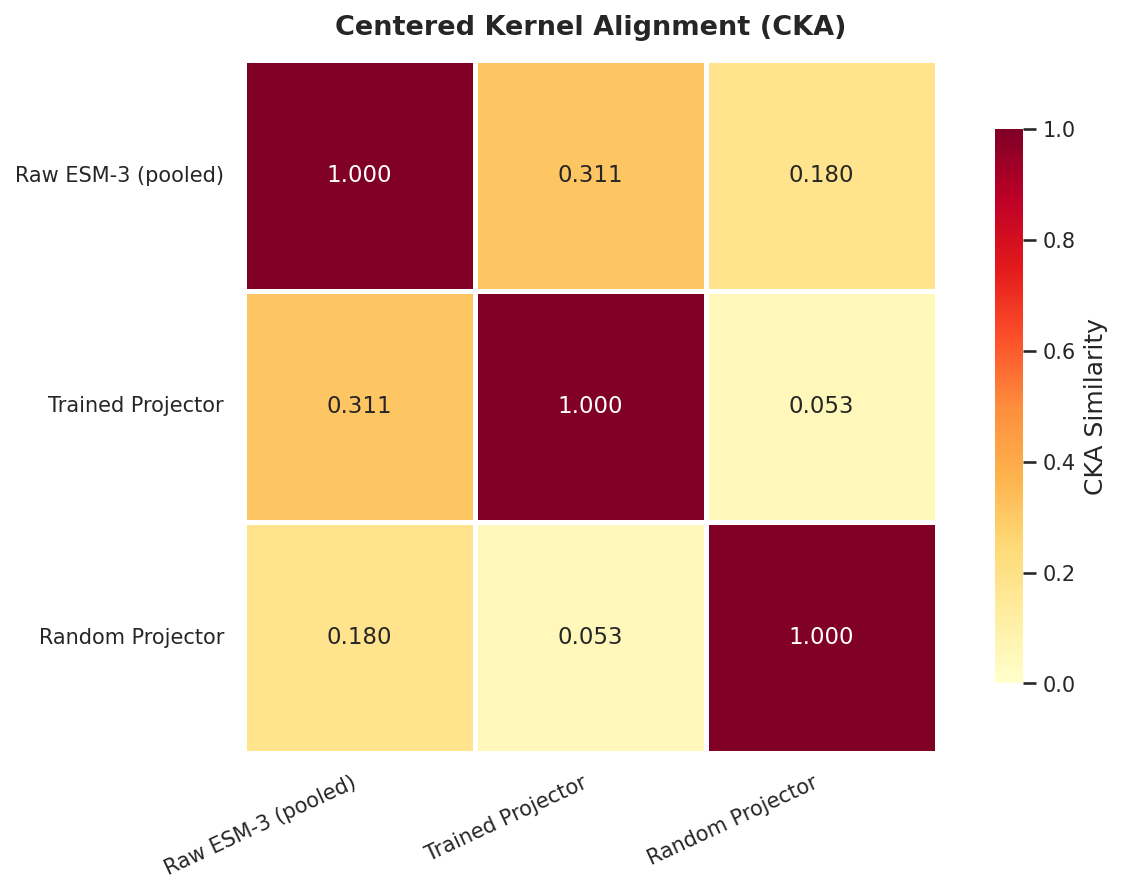
Centered Kernel Alignment (CKA) heatmap: representation similarity across layers between ESM-3 and the fine-tuned LLM.
What This Means
Data Diversity Hypothesis: Supported
Combining six sources produced substantially lower loss than single-source training. Scaling data from diverse sources yielded larger gains than scaling model size.
72% of proteins appear in multiple sources but described differently each time. Multiple annotation perspectives help generalization — though disentangling diversity from scale requires further experiments.
ESM-3 Embeddings Show a Clear SFT Advantage
On 4.89M: eval_loss 0.361 (ESM-3+MLP) vs 1.207 (text-only). The structural information in ESM-3's 1536-dim embeddings appears difficult to recover from sequences alone.
The Takeaway
Data diversity and scale are among the most impactful levers for protein LLM SFT performance.
- eval_loss: 1.91 → 0.361 on same 8B model (81% reduction from data scaling)
- BLEU: 0.315, ROUGE-L: 0.515 at best checkpoint
- 33.7% through training (headroom remains)
Part 3: Teaching a Protein LLM with RL — The Gradient Routing Problem (Mar 13, 2026)
SFT Results: The MLP Advantage
| Metric | ESM-3+MLP | Text-Only | MLP Advantage |
|---|---|---|---|
| Best eval_loss | 0.361 | 1.207 | 70.1% lower |
| Gradient norm (mean) | 0.627 | 2.365 | 3.8x lower |
SFT eval loss curves. MLP converged smoothly; text-only showed degradation after step 8000.
From Imitation to Reasoning: Enter GRPO
Group Relative Policy Optimization (GRPO): for each prompt, generate a group of completions (8-16). A reward function scores each, and the model updates toward better-rewarded outputs using policy gradient. Rewards are normalized within each group.
For structure quality, we designed a multi-component reward:
- Quality alignment (0.4): Correct structural quality categorization based on pLDDT
- Numerical accuracy (0.3): Predicted vs actual pLDDT closeness
- Category match (0.3): Quality category (high/medium/low/very low) match
- Format bonus (0.1): Expected JSON format compliance
Training data: 5,878 protein sequences folded by ESMFold to produce ground-truth structural quality metrics. We ran 13 GRPO experiments over three days.
The Reversal: Text Wins at RL
The text-only model (the worse SFT model) rapidly learned structure quality assessment: 0.832 mean reward, near-perfect format compliance, and remarkably calibrated pLDDT predictions (79.1 predicted vs 79.7 actual).
The MLP model showed 0.582 reward in its initial configuration: format compliance stuck at 65%, pLDDT underestimated (67.9 vs 79.7). A separate run reached 0.780, but text-only still led.
GRPO reward curves showing text-only outperforming MLP. The model with better SFT is worse at RL.
Diagnosing the Problem: Follow the Gradients
| Model / Task | LoRA Gradients | Multimodal Gradients |
|---|---|---|
| MLP, Structure GRPO | ~0 (frozen out) | 0.247 |
| MLP, ProteinLM GRPO | 0.826 | 0.0 (frozen out) |
| Text-only, Structure GRPO | 0.476-0.493 | N/A |
Gradient norms revealing the routing problem: one subsystem captures signal, starving the other.
This is the gradient routing problem: gradients flow predominantly to one subsystem during GRPO, largely starving the other. The "winner" depends on the reward function and task characteristics.
During SFT, every token contributes to loss, distributing gradients through both projector and LoRA. During GRPO, the reward is a single scalar — creating a "winner-take-all" dynamic where the steepest local descent captures the signal.
The Fix (Partial): Freeze and Focus
Freeze the multimodal projector completely and only update LoRA during GRPO. This eliminates the competition:
| Configuration | Mean Reward | Format Bonus | LoRA Grad | MM Grad |
|---|---|---|---|---|
| Text-only (standard) | 0.832 | 0.099 | 0.476 | 0.0 |
| MLP best run | 0.780 | — | — | — |
| MLP frozen-MM | 0.774 | 0.095 | 0.071 | 0.0 |
| MLP frozen-MM + focal | 0.725 | 0.095 | 0.119 | 0.0 |
| MLP standard (gradient-starved) | 0.582 | 0.065 | ~0 | 0.247 |
Frozen-MM: reward jumps from 0.582 to 0.774. Format compliance from 65% to 95%. The gradient routing problem was the primary bottleneck.
But text-only still wins (0.832). Even with projector frozen, LoRA gradients (0.071-0.119) are smaller than text-only (0.476) — the 32-token compression creates an information bottleneck.
Reward Breakdown: Component-Level Analysis
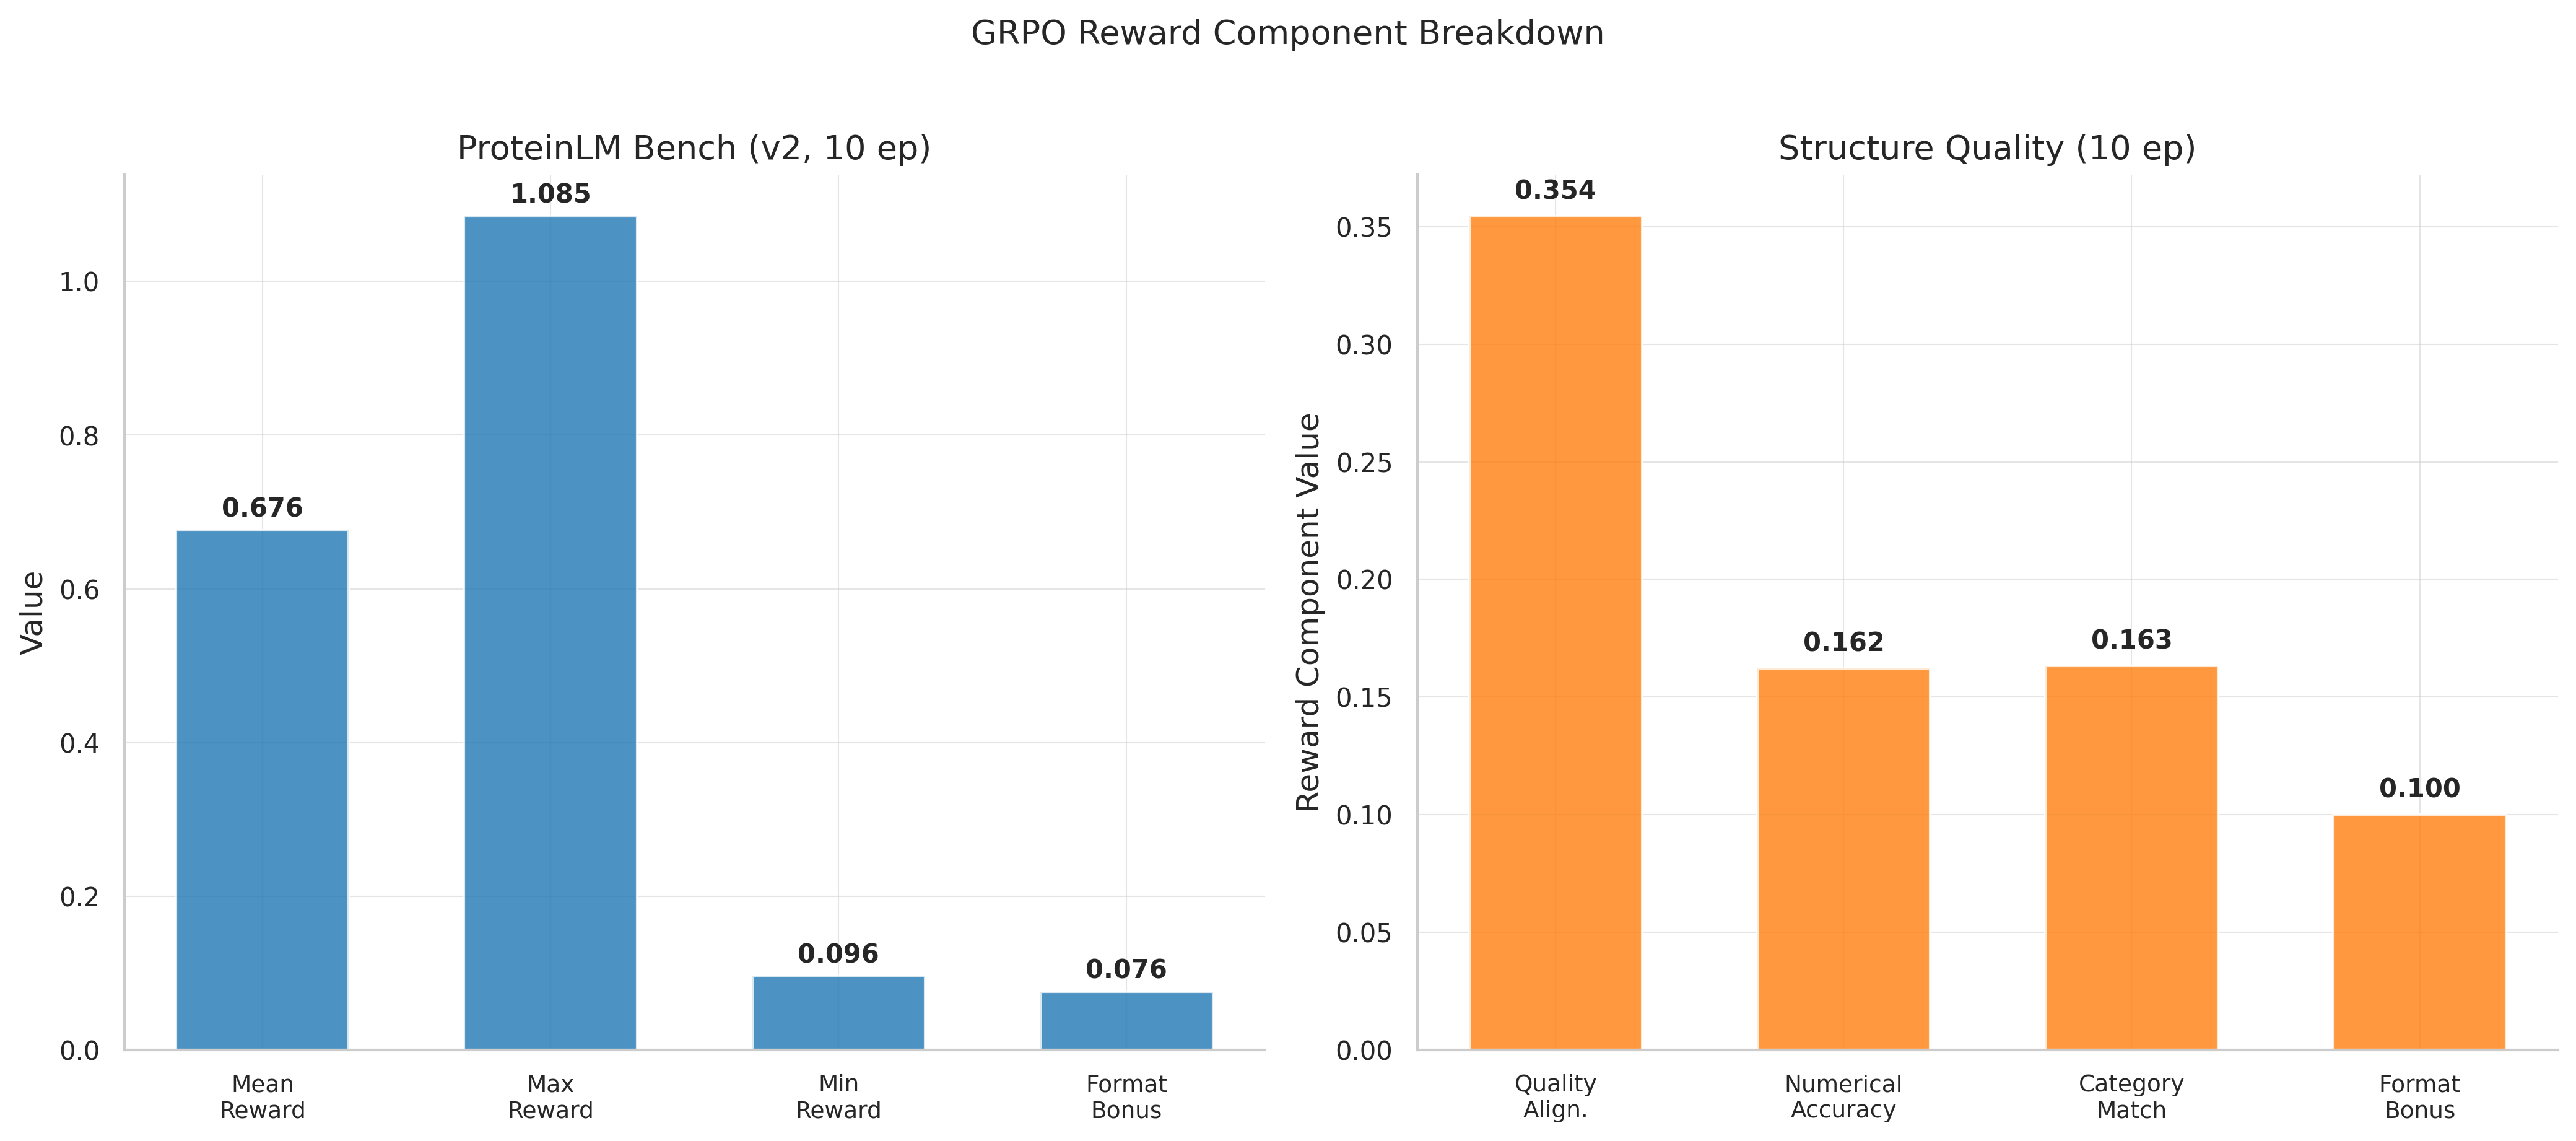
Biggest gaps in numerical accuracy (text: 0.185, standard MLP: 0.086) and category match (text: 0.197, standard MLP: 0.104). Quality alignment closer (text: 0.351, standard MLP: 0.326).
pLDDT calibration: Actual mean 79.7. Text-only predicts 79.1 (remarkably close). Frozen-MM overestimates at 85.1. Standard MLP underestimates at 67.9. The projector embeddings contain strong signal but GRPO fails to calibrate it properly.
Supplementary: Reward breakdown, format compliance & all GRPO runs
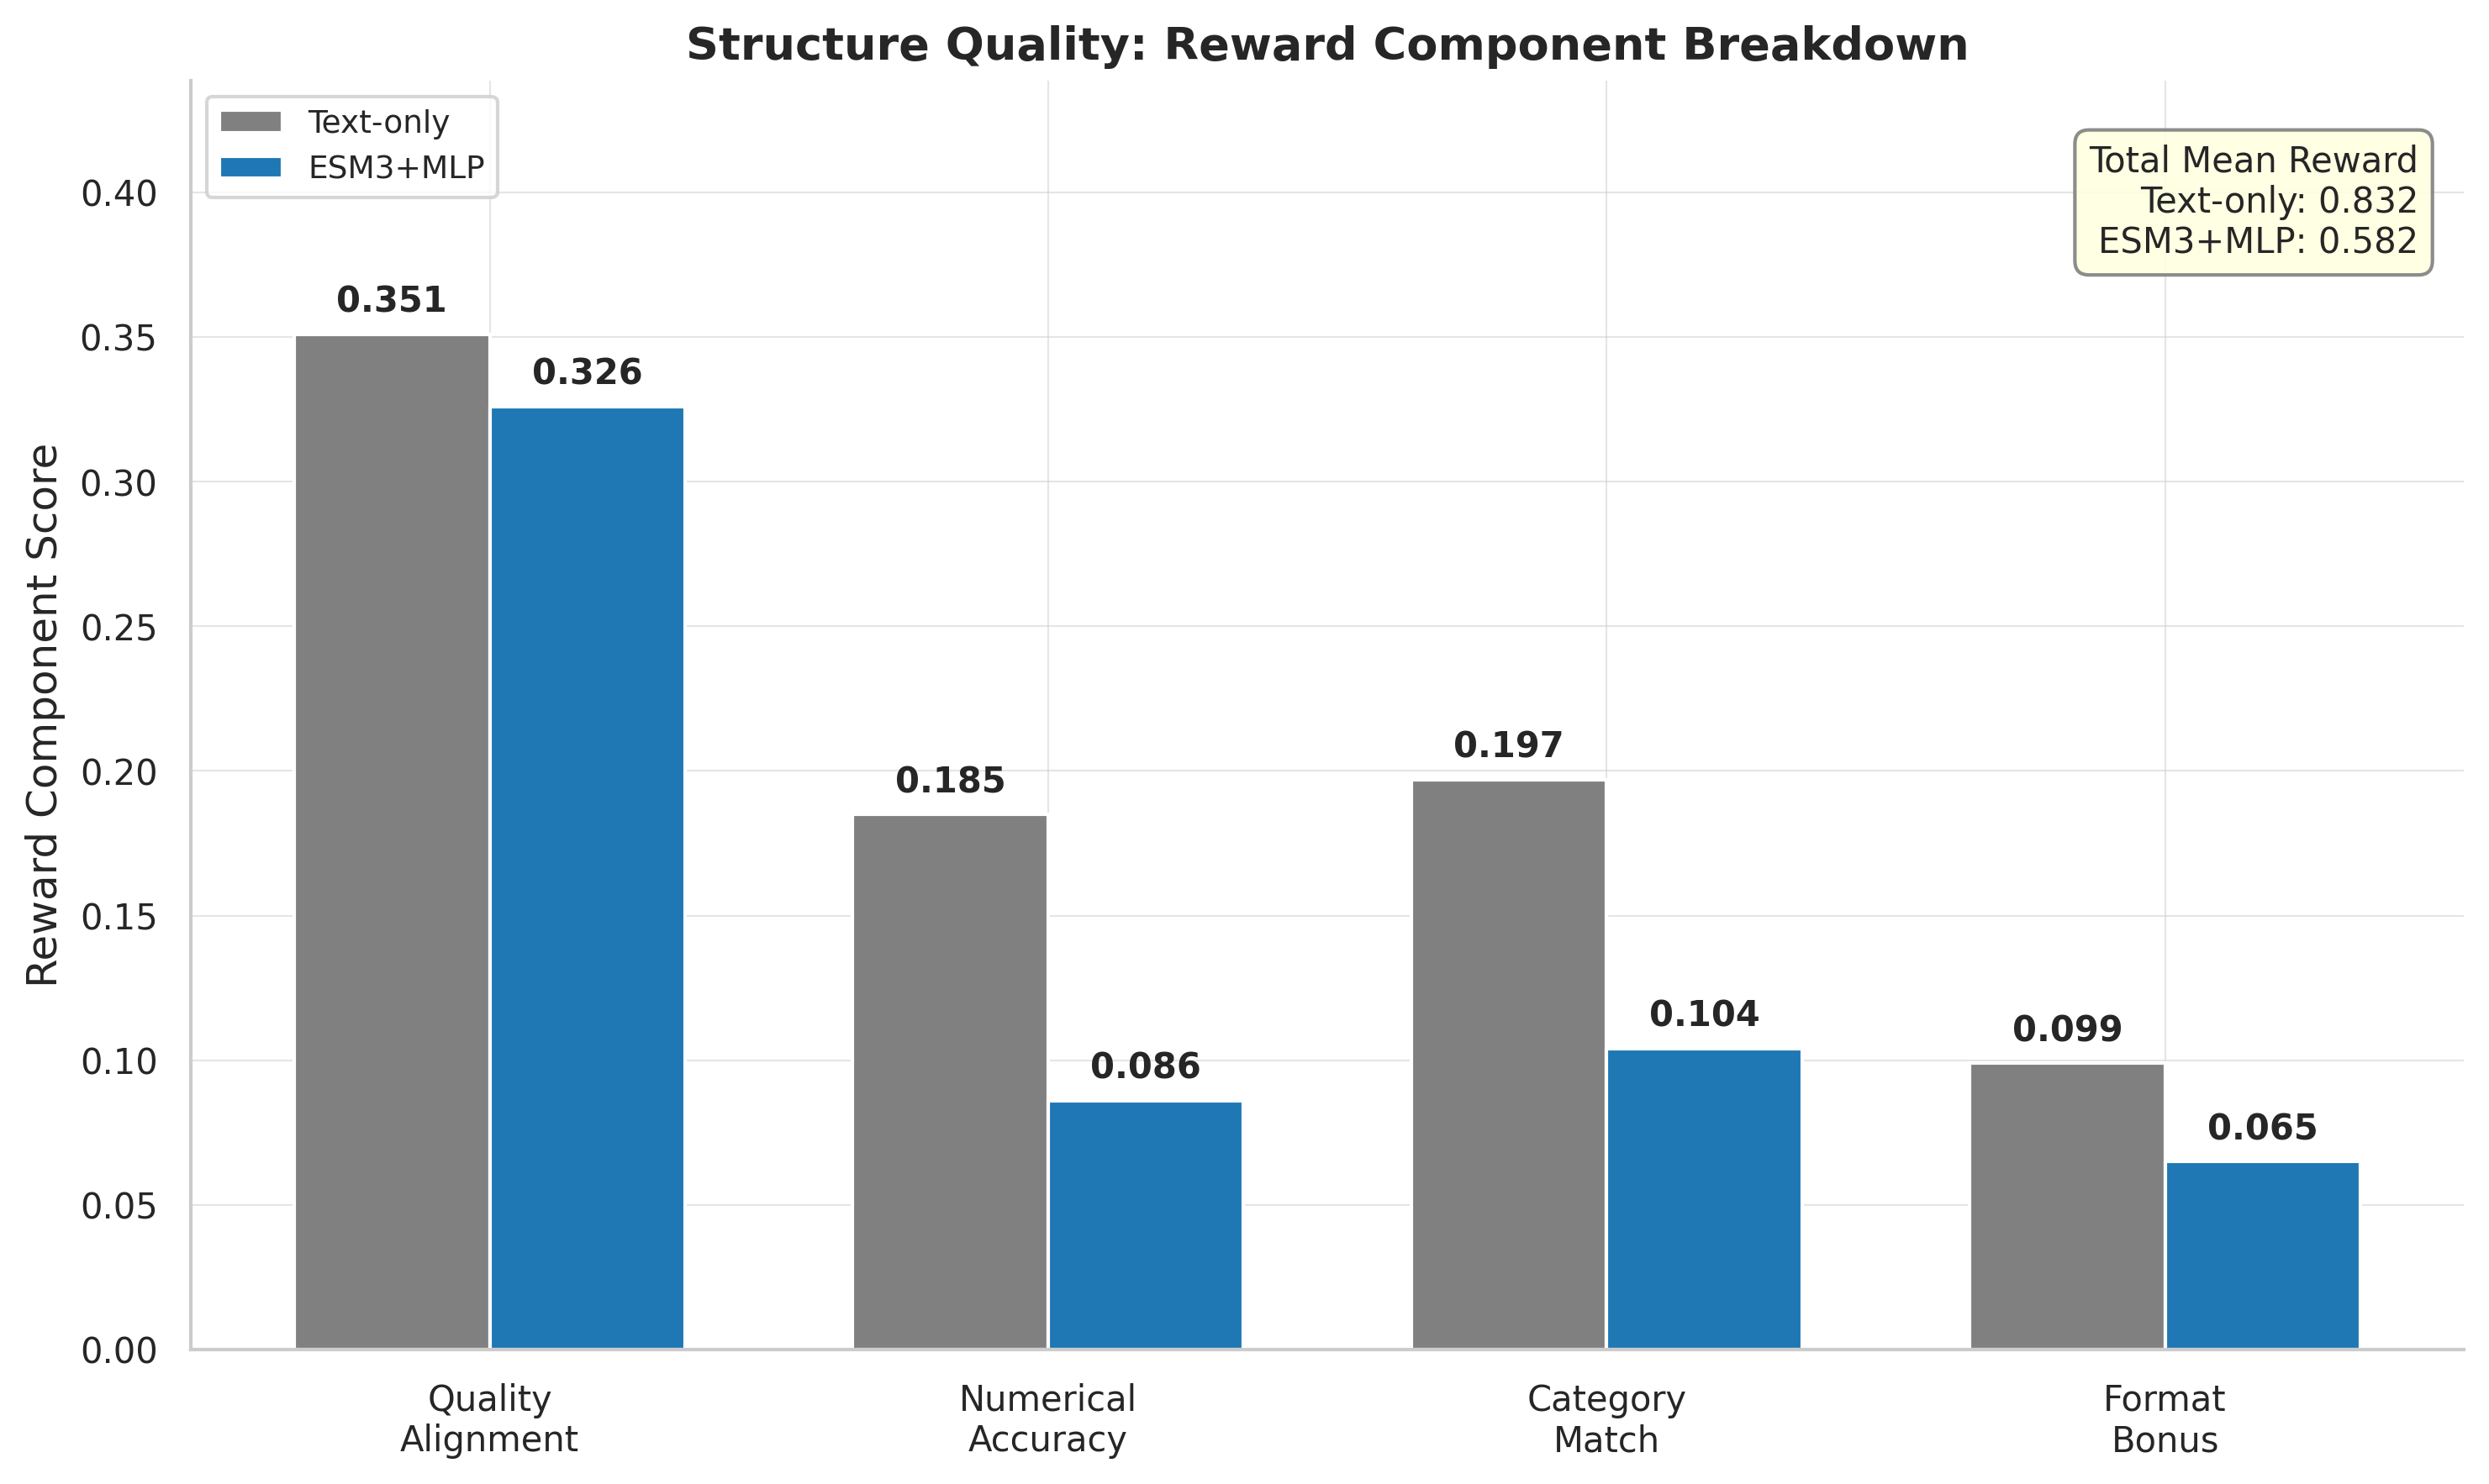
Reward component breakdown: text-only outperforms across all four components.
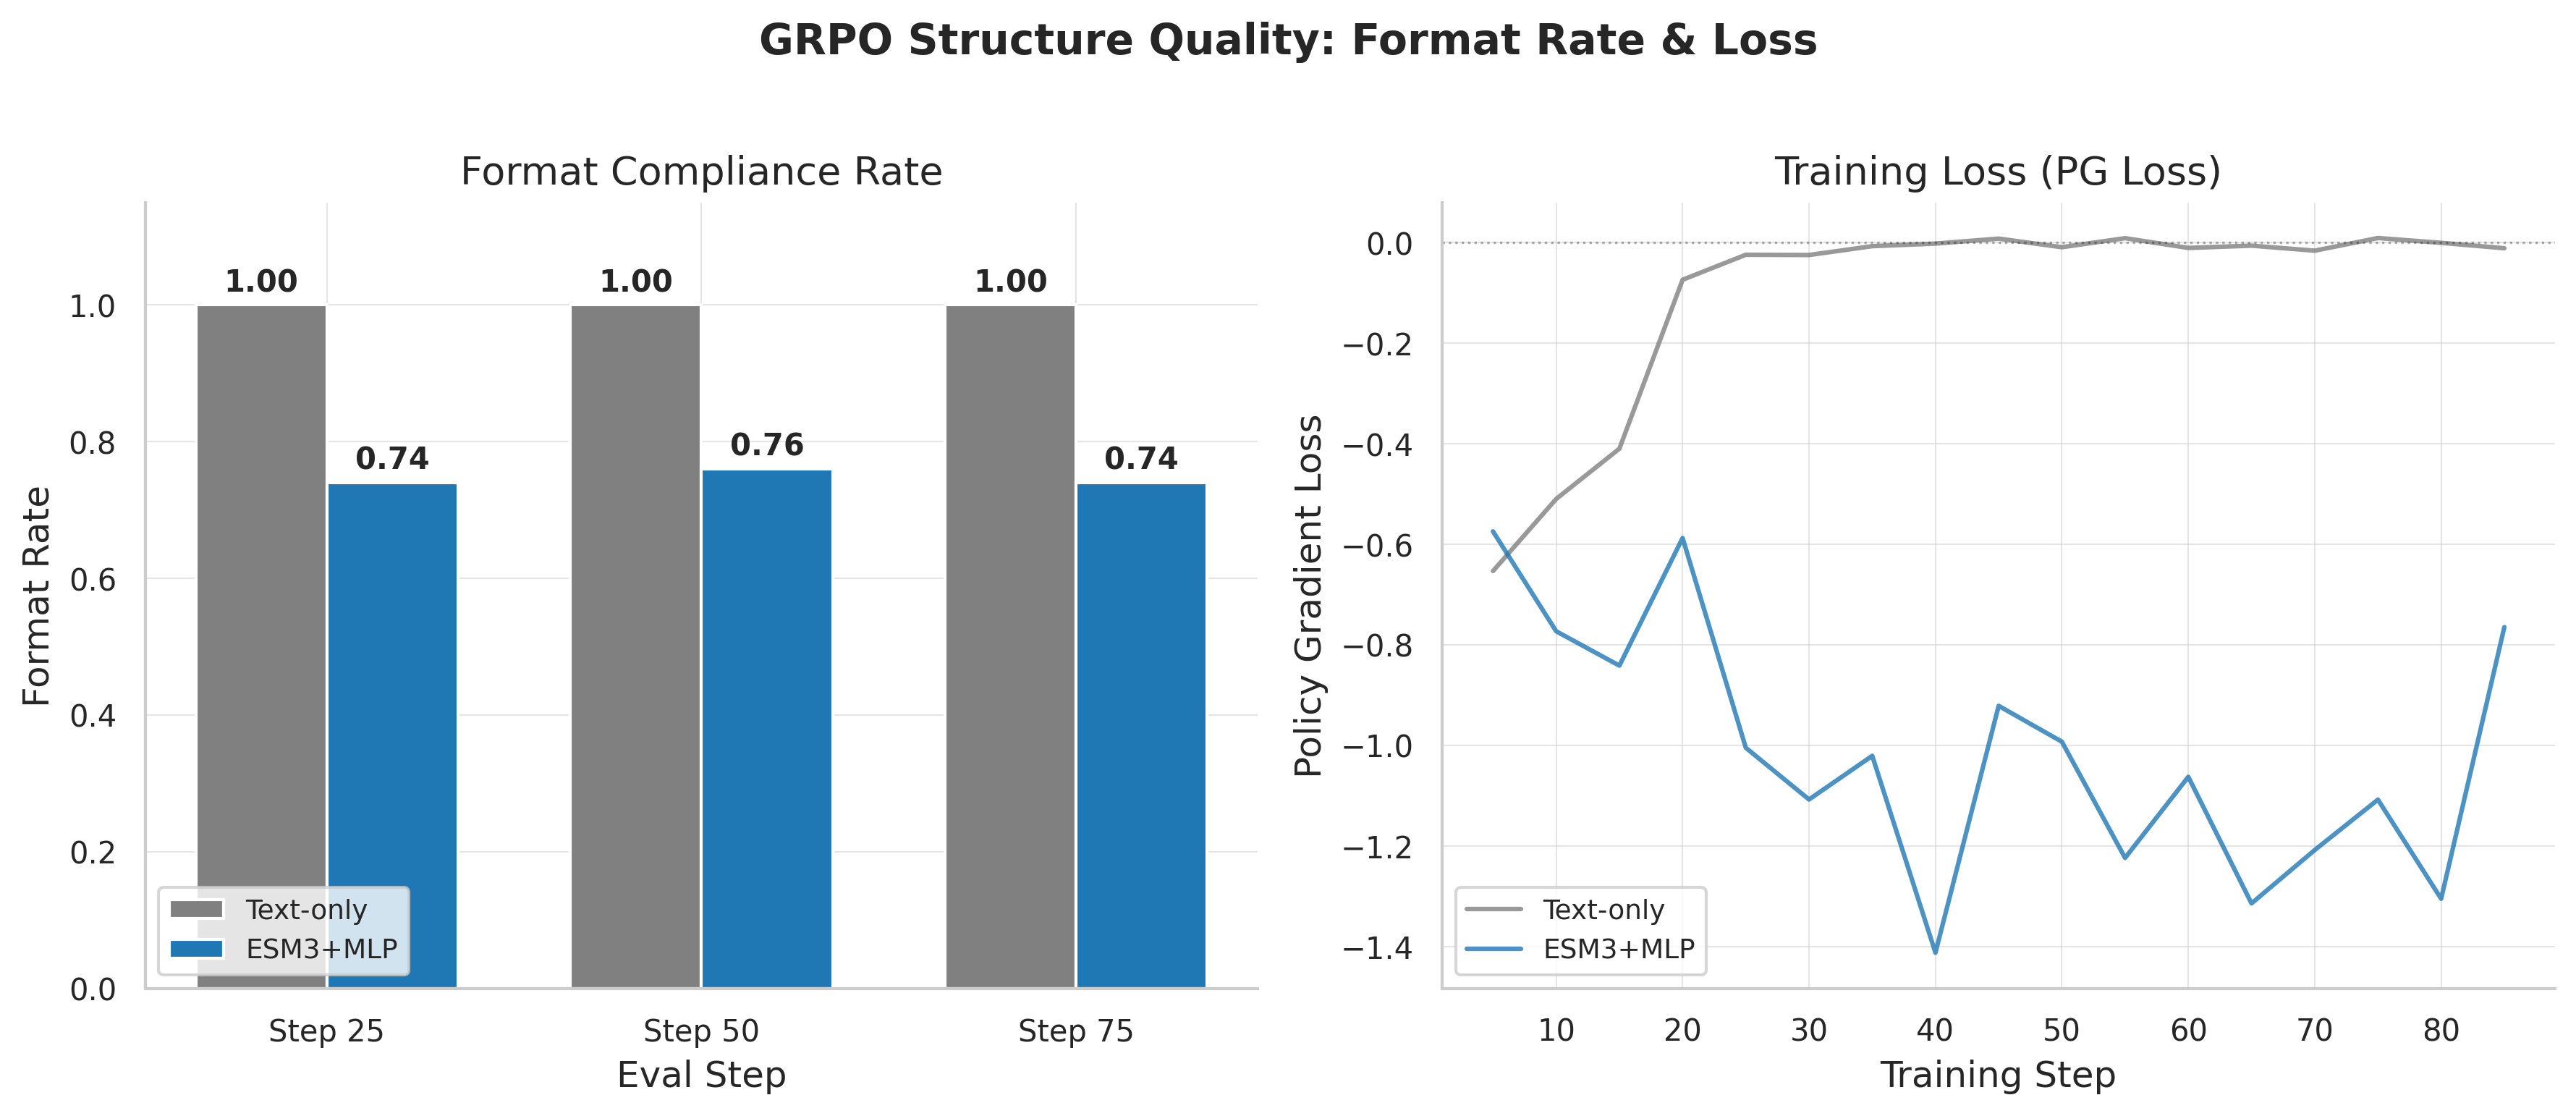
Format compliance: text-only reaches ~100% early. Standard MLP stuck at 74-76%. Frozen-MM recovers to ~95%.
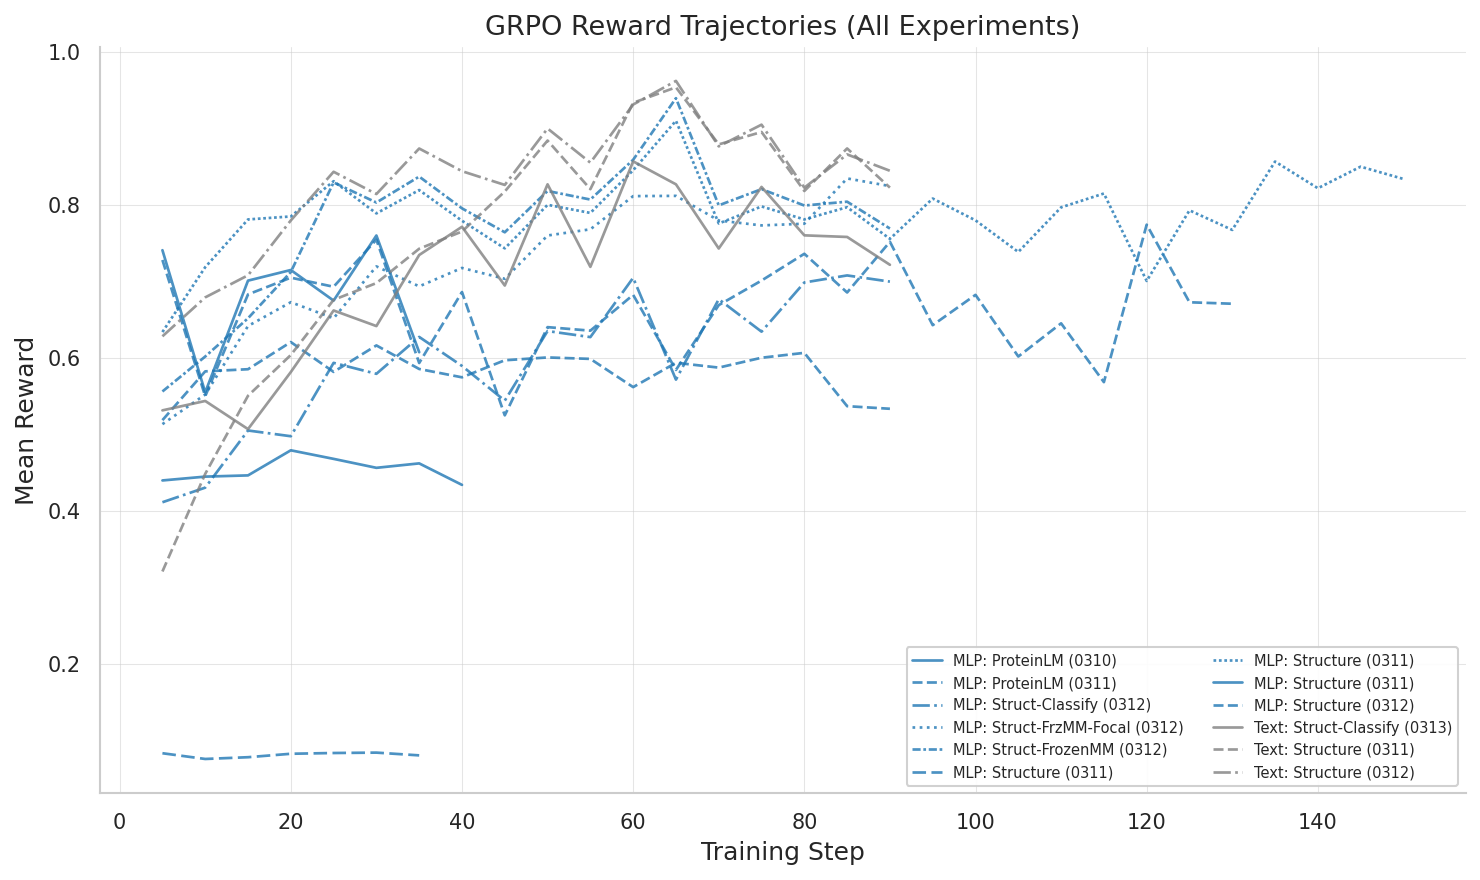
All 13 GRPO experiments compared: reward trajectories across different configurations and tasks.
ProteinLM benchmark GRPO: reward breakdown showing zero-variance groups and wasted compute.
ProteinLM Benchmark: A Negative Result
GRPO on 849 multiple-choice protein questions: clear negative result. Neither 3-epoch (reward 0.695) nor 10-epoch (reward 0.676) showed improvement. 37-42% of groups had zero reward standard deviation — identical completions within each group meant zero gradient signal. Nearly half the compute was wasted.
Interestingly, gradient routing was reversed: LoRA received healthy gradients (0.8) while multimodal gradients were exactly zero.
What This Means for Multimodal RL
In SFT, every token contributes to loss, and chain rule distributes gradients through both projector and LoRA. In GRPO, the sparse scalar reward creates competition — a "winner-take-all" dynamic resembling gradient conflicts in multi-task learning.
Scope caveat: Observed on two GRPO tasks with one architecture (MLP projector). Generalization to other multimodal RL settings remains untested.
What's Next
- Two-stage GRPO. Frozen projector first (format + basic reward via LoRA), then unfreeze for structural refinement.
- Gradient balancing. GradNorm or PCGrad to prevent winner-take-all dynamics.
- The Perceiver pathway. Cross-attention may produce different gradient routing behavior.
The Central Paradox
Our best SFT model (MLP, eval_loss 0.361) produces our worst GRPO learner (reward 0.582), while our weaker SFT model (text-only, eval_loss 1.207) produces our best GRPO learner (reward 0.832). This SFT→RL inversion is the key challenge for the next phase.
Key References: ESM-3 · Mol-Instructions (ICLR 2024)
This analysis covers 4 SFT and 13 GRPO experiments run between March 6-13, 2026, on 8x H100 GPUs. All models use Qwen3-8B-Instruct-2507 with LoRA (r=8). The combined SFT dataset contains 4.89M instruction-response pairs from six protein data sources.