Protein LLM Part 2: Scaling to 4.9 Million Samples
From 50K to 4.9M training samples — how scaling data transformed our protein-understanding LLM, what the numbers look like, and what comes next.
We scaled our protein-LLM training from 50K samples on Qwen3-4B to 4.9 million samples on Qwen3-8B across six sources. Combined, these changes reduced eval_loss from 3.64 to 0.361 — though model scaling and data scaling both contributed to this gain.
The 4.89M combined dataset described in this post was later refined to 1.82M samples after discovering significant protein overlap between train and evaluation splits in three sources (ProtDescribe, Swiss-Prot, Protein2Text-QA). All results below — including the 0.361 eval_loss and 70.1% MLP advantage — reflect the original 4.89M training and may not hold on the curated dataset. See the series overview for the current project state.
Where We Left Off
In Part 1, we built the foundation: a frozen ESM-3 protein encoder connected to Qwen3-8B through a learnable MLP projector. We trained on 50K samples from Mol-Instructions, proved the architecture converges, and assembled a 4.5M-record dataset from six sources.
The question now: does more data actually help?
The Scaling Experiment
We trained the same ESM-3 + MLP architecture on the full combined dataset: 4.89 million instruction pairs spanning protein function prediction, catalytic activity, domain analysis, gene prediction, and more.
| What Changed | Before | After |
|---|---|---|
| Training samples | 50K (one source) | 4.89M (six sources) |
| Dataset diversity | 5 task types | 15+ task types |
| Annotation styles | Template-based only | Paragraphs, QA, structured |
| Total training steps | 2,595 | 28,941 |
Everything else stayed constant: Qwen3-8B-Instruct, ESM-3 small (frozen), MLP projector, LoRA on all linear layers, 8x H100 GPUs with FSDP.
The Results
Loss Dropped Off a Cliff
The combined dataset didn’t just incrementally improve things — it fundamentally changed the loss landscape.
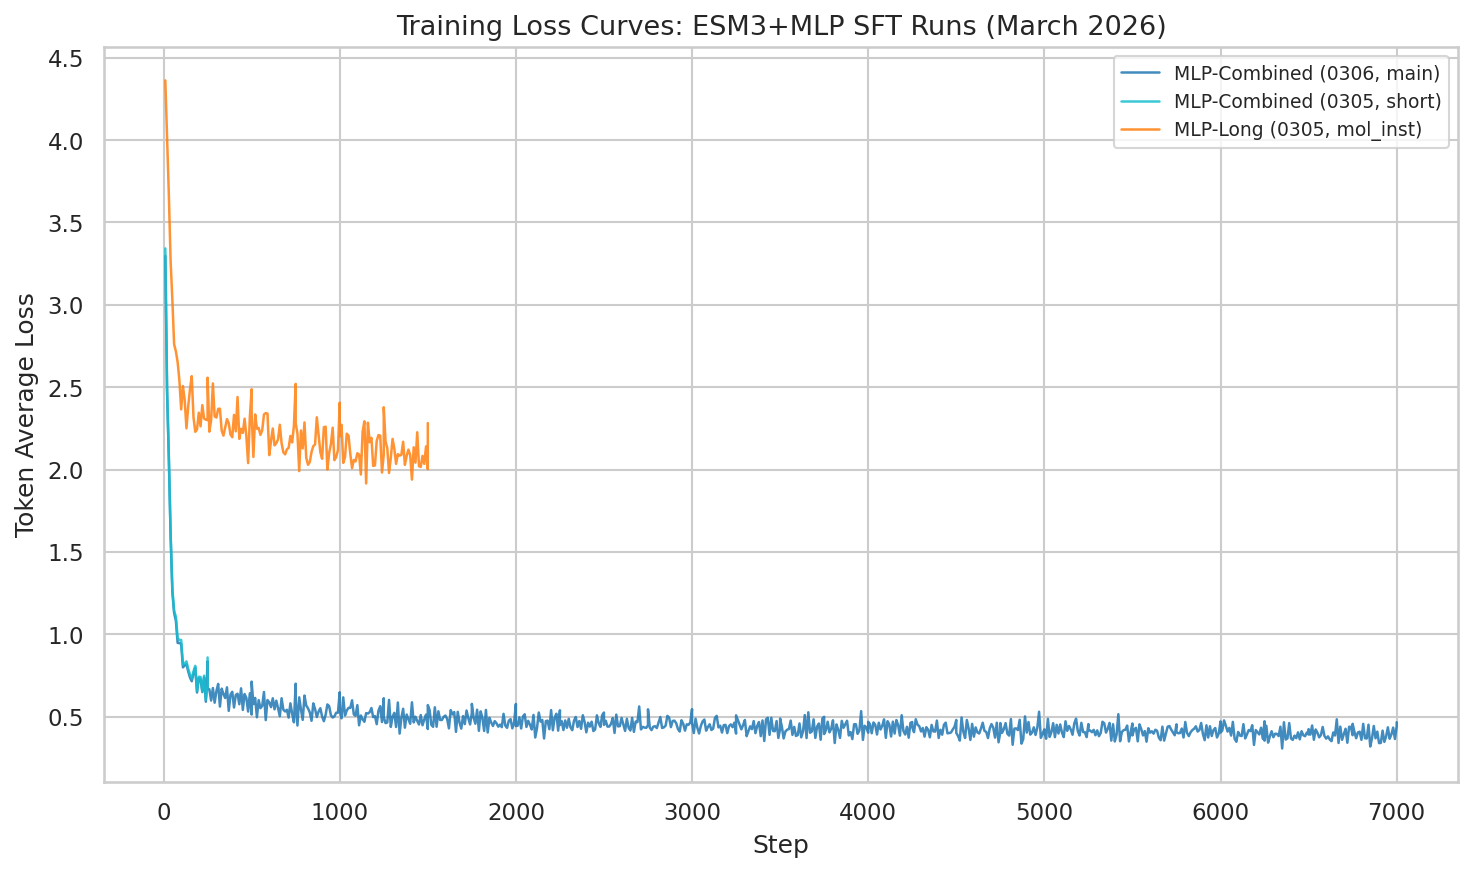
Training loss (token_avg_loss) showing continued improvement through epoch 1 (step 9,750). The combined dataset produces dramatically lower loss than single-source training.
At step 9,750 (33.7% through training, epoch 1 complete), the model has achieved:
| Metric | Combined 4.9M (MLP) | Text-Only on 4.9M | Mol-Instr Only (505K) |
|---|---|---|---|
| eval_loss | 0.361 | 1.207 | 1.908 |
| token_avg_loss | 0.366 | 1.643 | 2.282 |
| MLP advantage vs text | — | 70.1% lower | 81.1% lower |
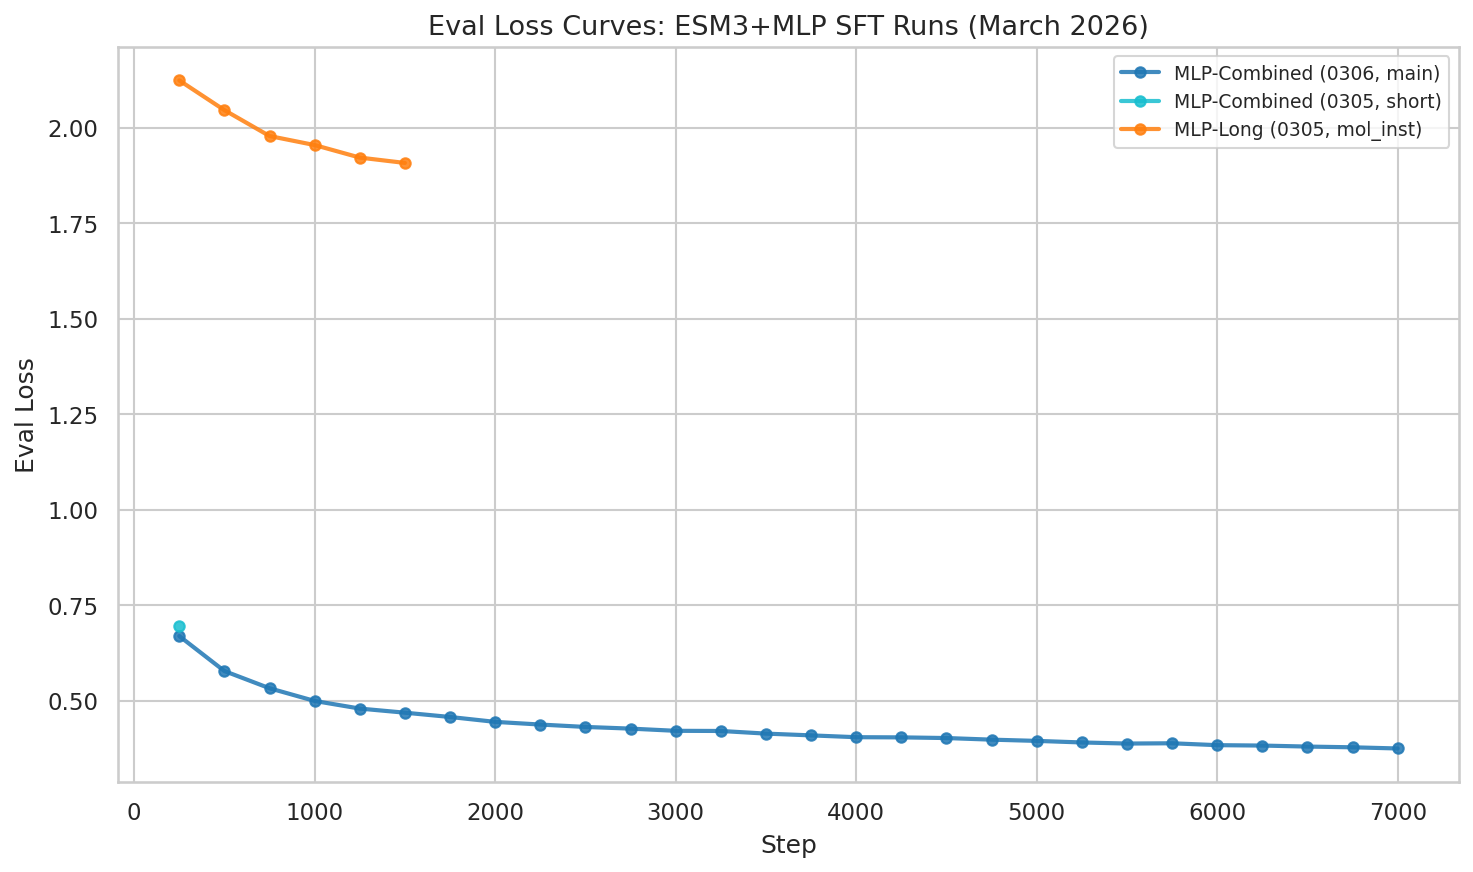
Eval loss at epoch 1 checkpoint: 0.361 — dramatically lower than the mol-instructions-only run (1.908).
The Two Biggest Levers
Looking back at two weeks of experiments, two changes drove the most improvement:
| Date | Change | eval_loss | Improvement vs baseline |
|---|---|---|---|
| Feb 20 | First run (Qwen3-4B, 50K) | 3.64 | baseline |
| Feb 23 | Scale model: 4B → 8B (50K) | 1.94 | 47% |
| Feb 27 | Text-only baseline (8B, 505K) | 2.42 | 33% |
| Mar 5 | MLP on full mol-instructions | 1.91 | 48% |
| Mar 7 | Combined 4.89M dataset | 0.361 | 90% |
Caveat: The 3.64 → 0.361 comparison spans both a model change (4B → 8B) and a data change (50K → 4.89M). The cleanest data-scaling comparison is on the same 8B model: 1.91 (505K, mol-instructions only) → 0.361 (4.89M, six sources), an 81% reduction. Model scaling alone (4B → 8B on 50K data) gave a 47% reduction (3.64 → 1.94). Data scaling on the 8B model gave a larger improvement, though these are not perfectly controlled ablations (data diversity and scale changed simultaneously).
With diverse data sources, the model sees the same proteins described in multiple ways — function annotations, structural domains, QA pairs, long-form descriptions. It’s like studying a subject from six different textbooks instead of one — though we cannot fully disentangle the effects of data diversity from data scale without further experiments.
First Generation Quality Numbers
For the first time, we measured how well the model actually generates protein descriptions:
Best generation metrics were achieved at step 9,250:
| Metric | Best Value (step 9,250) |
|---|---|
| BLEU | 0.315 |
| ROUGE-L | 0.515 |
Note: these scores declined slightly by the final checkpoint (step 9,750: BLEU 0.255, ROUGE-L 0.481), suggesting some overfitting to the training distribution in later steps.
The model is strongest on catalytic activity and function prediction — tasks where the training data is richest. Domain/motif prediction lags behind, likely because its outputs are more structured (specific domain names and boundaries) rather than free-form text.
ROUGE-L of 0.515 means the model captures roughly half the content of reference answers. These are moderate scores — the model produces relevant outputs but is far from matching reference quality. They provide a starting point for reinforcement learning to build on.
Under the Hood: Training Stability
Gradient Norms
One concern with scaling to 4.9M samples from diverse sources: would the varied annotation styles cause training instability?
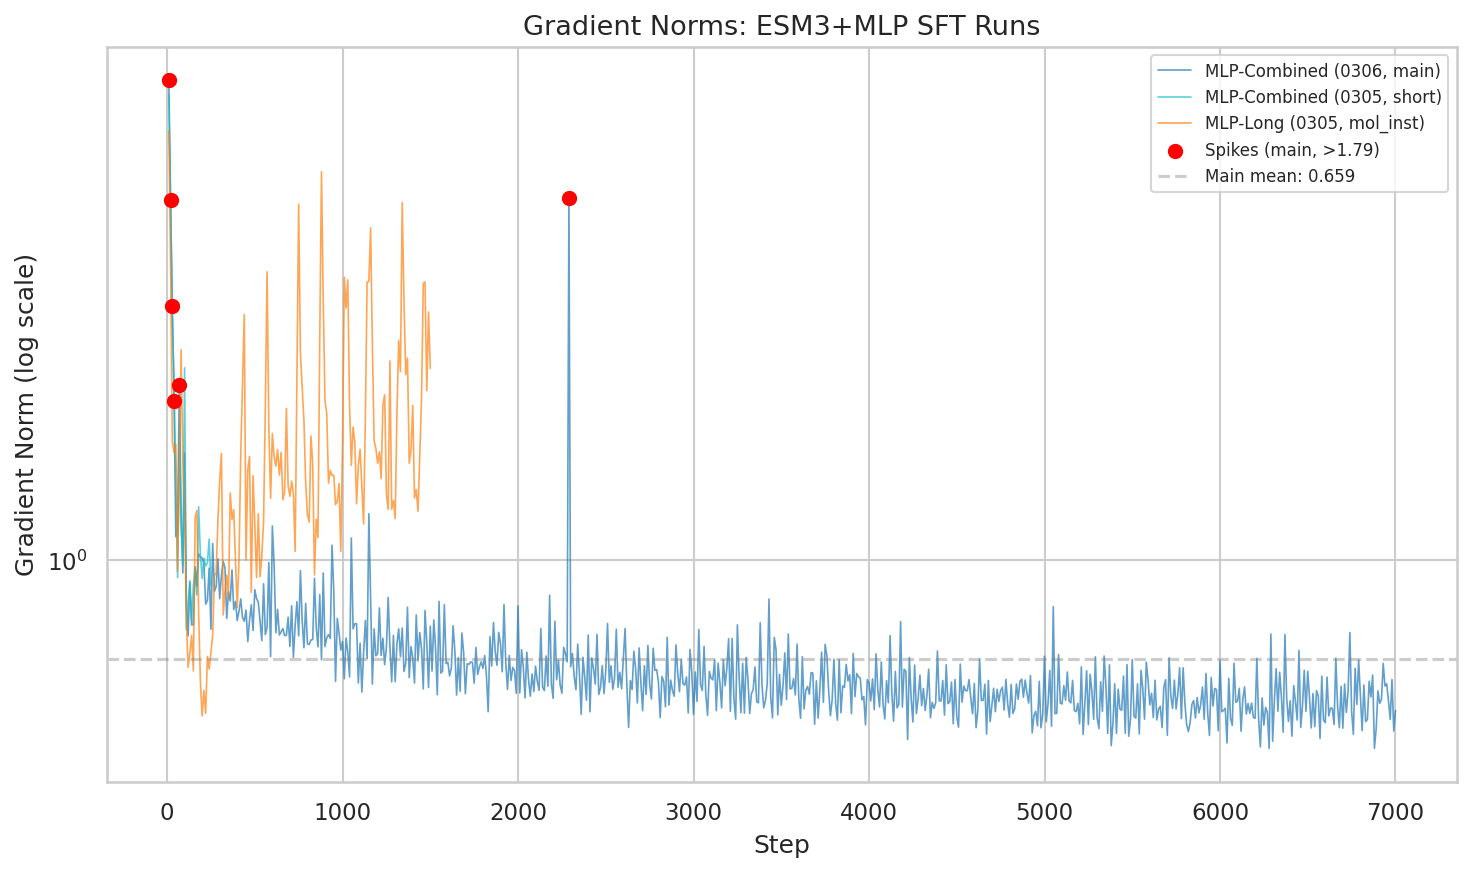
Gradient norm trajectories across runs. The main combined run stabilizes to a mean of 0.627 after initial spikes in the first 100 steps.
The answer: brief instability early on (steps 10-100), then rock-solid stability. The mean gradient norm settled at 0.627 — lower than both the mol-instructions-only run (1.67) and the text baseline (1.48). More diverse data actually made optimization smoother.
Still Improving
The most exciting part: the run is 33.7% complete (epoch 1 of 3). Both train and eval loss are still declining with no sign of plateau. With the cosine learning rate schedule decaying through epochs 2-3, we expect continued improvement.
Architectural Comparison
MLP vs Perceiver on Small Data
On the 50K mol-instructions dataset, MLP and Perceiver Resampler achieve nearly identical performance: eval_loss 1.942 vs 1.952 (MLP wins by 0.5%). The simpler MLP projector (30.5M params) captures the essential protein-to-language mapping as well as the more complex Perceiver (29.4M params) at this data scale.
Four-Way Comparison Status
The core thesis of this project is a systematic comparison of protein-to-LLM bridging architectures. At the time of writing, only MLP had been trained on the full dataset:
| Approach | Projector Params | 50K eval_loss | 4.89M eval_loss |
|---|---|---|---|
| Text-only | — (LoRA only) | 2.415 | 1.207 |
| MLP | 30.5M | 1.942 | 0.361 |
| Perceiver Resampler | 29.4M | 1.952 | Not yet run |
| Flamingo (gated cross-attn) | ~120-150M | — | Not yet run |
The Perceiver and Flamingo at-scale experiments remain a priority. See the series overview for current status.
What This Means
The Data Diversity Hypothesis: Supported (Not Yet Confirmed)
Combining six sources with different annotation styles, task types, and protein coverage produced a model with substantially lower loss than single-source training. The key observation: scaling data from diverse sources yielded larger gains than scaling model size.
72% of proteins appear in multiple sources — but described differently each time. The model sees BRCA1 as “a DNA repair protein” (Mol-Instructions), “involved in homologous recombination” (Swiss-Prot), “contains BRCT domains” (ProteinLMDataset), and in a detailed functional description (SwissProtCLAP). We hypothesize that multiple annotation perspectives help generalization, but confirming this requires controlled experiments that hold data volume constant while varying diversity.
ESM-3 Embeddings Show a Clear SFT Advantage
On the 4.89M dataset, the ESM-3 encoder provides a large eval_loss advantage over text-only processing (0.361 vs 1.207). The structural information encoded in ESM-3’s 1536-dimensional embeddings — fold types, binding sites, evolutionary constraints — appears difficult to recover from amino acid sequences alone. However, as we discuss in Part 3, this advantage does not automatically transfer to reinforcement learning, and these numbers are from the pre-curation 4.89M dataset.
What’s Next
Complete the training run. At the time of writing, the MLP run was 33.7% complete. The final results are reported above.
Text-only baseline completed. The text-only model on 4.89M reached eval_loss of 1.207 — confirming the MLP’s 70.1% advantage. The full comparison is in Part 3.
Perceiver and Flamingo at scale. Both architectures are implemented and validated on 50K data but remain untested at full scale.
GRPO reinforcement learning. Using verifiable rewards (GO term F1, stability prediction, ESMFold structural quality) to push beyond SFT. The results — including a surprising reversal where text-only outperforms MLP at RL — are in Part 3.
Resources
Project Repository: Post_Training_Protein_LLM
Related Posts:
Key References: